Greater Atlanta and North Metro Area Real Estate Market for October 2023

Greater Atlanta and North Metro Area Real Estate Market for October 2023

  • Amy Pedersen
  • November 21, 2023

Get the latest insights on the real estate market in and around Atlanta, including the surrounding Atlanta area suburbs. The statistics below are indicative of how the dichotomy of higher interest rates and a low housing inventory are impacting the Greater Atlanta real estate market. From the bustling streets of Sandy Springs to the charming communities of Woodstock and Roswell, the real estate landscape saw some interesting developments in October. 

Atlanta
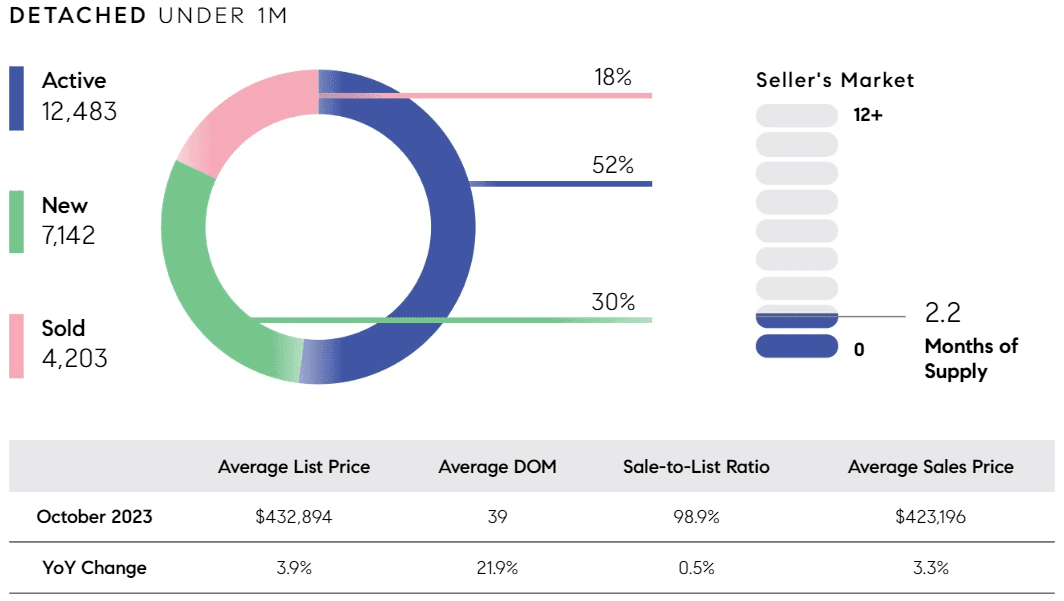
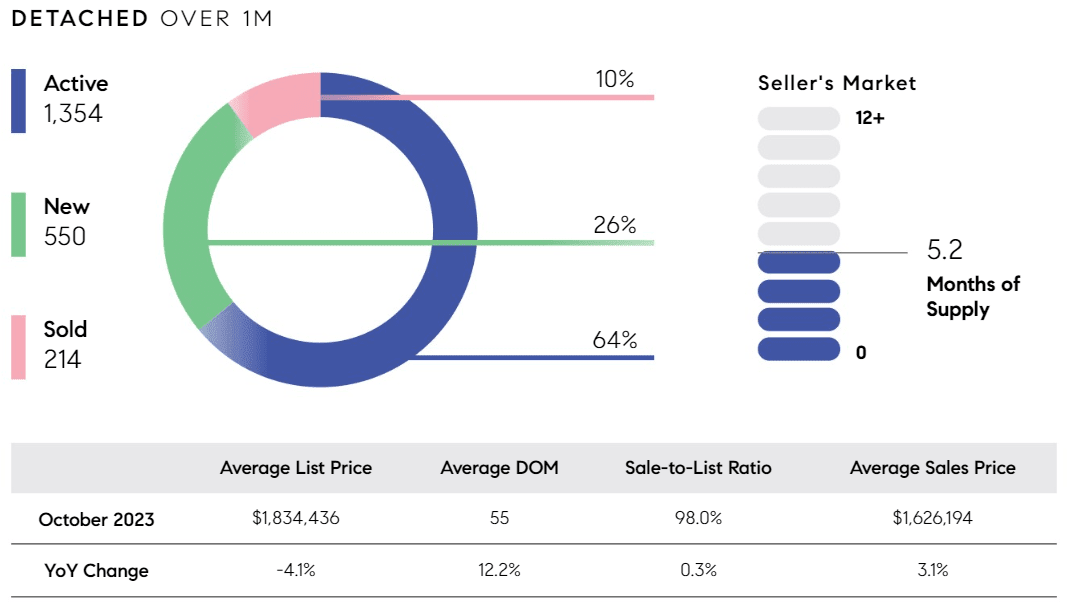
October 2023 detached-home market infographic with listing shares, prices, days on market, and months of supply.


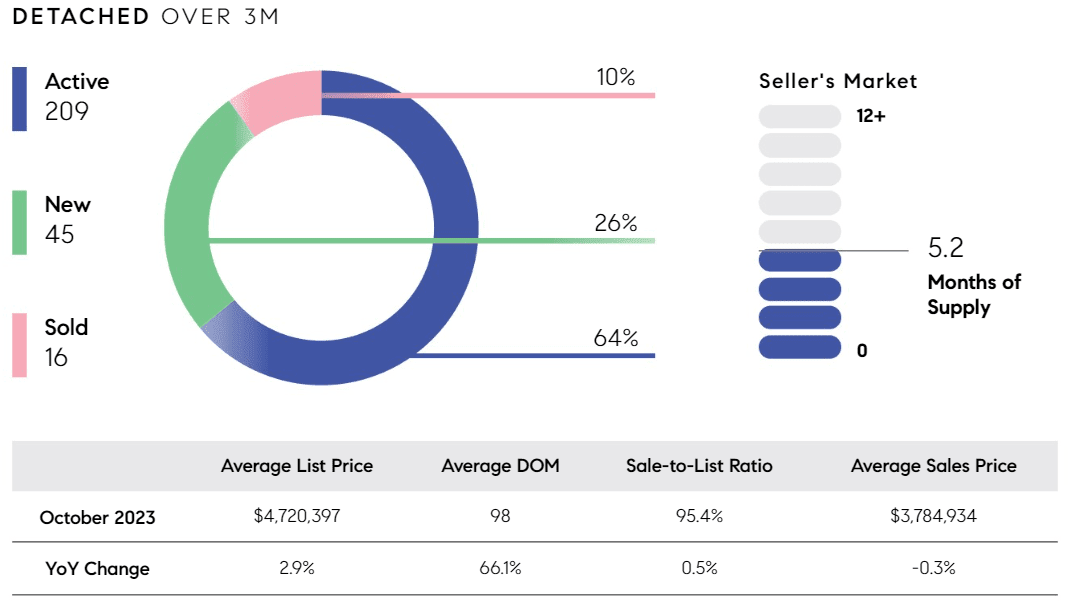
October 2023 Atlanta luxury detached-home market statistics and months of supply.


October 2023 detached-home market infographic with inventory, sales, prices, and 5.2 months of supply.


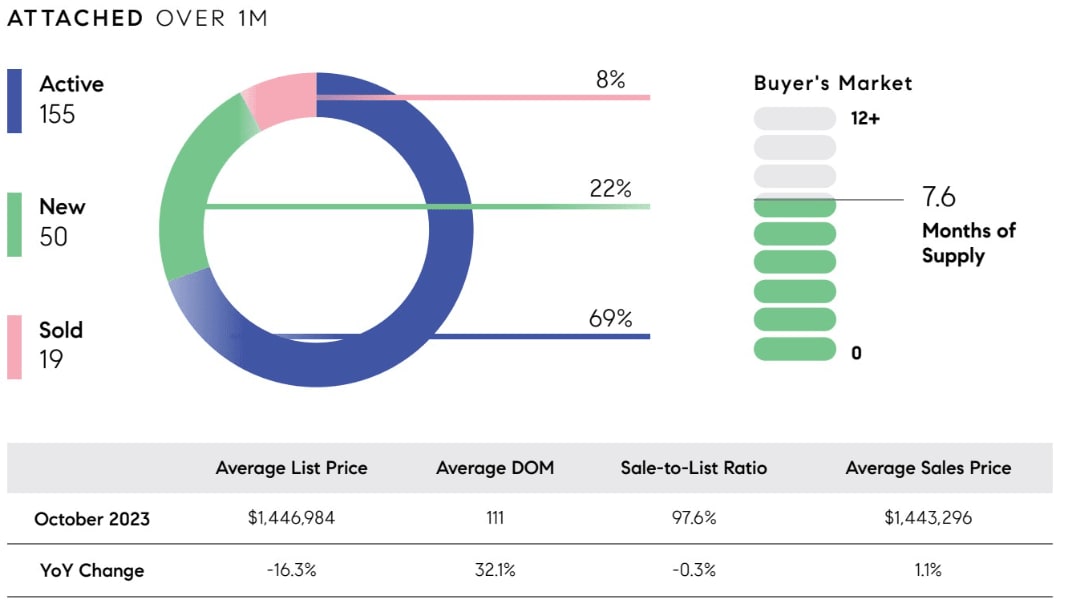
October 2023 real estate market statistics, including 155 active listings, 50 new listings, 19 sold, and 7.6 months of supply.


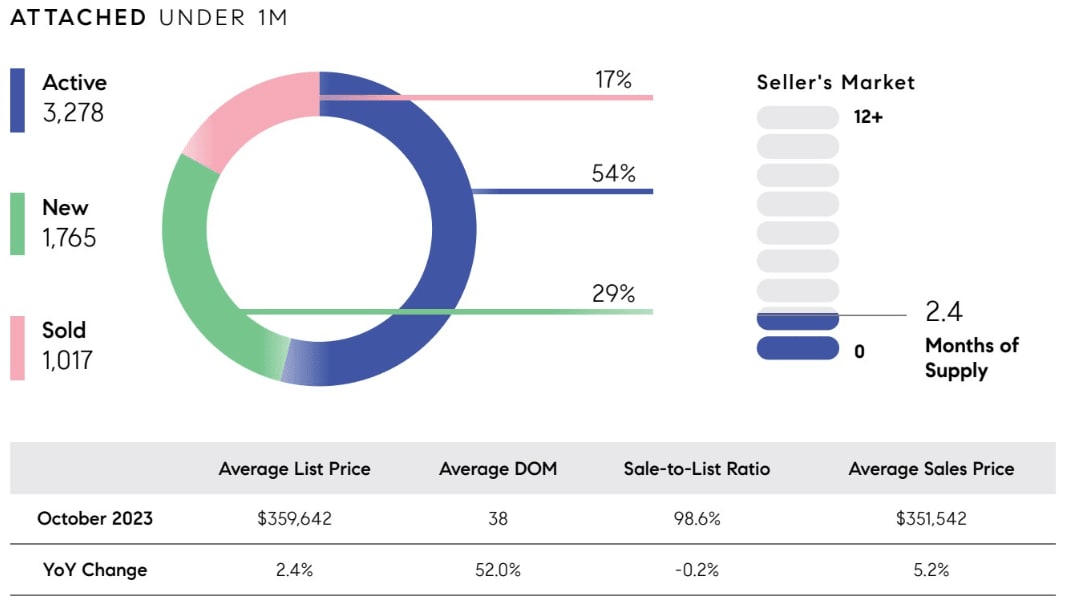
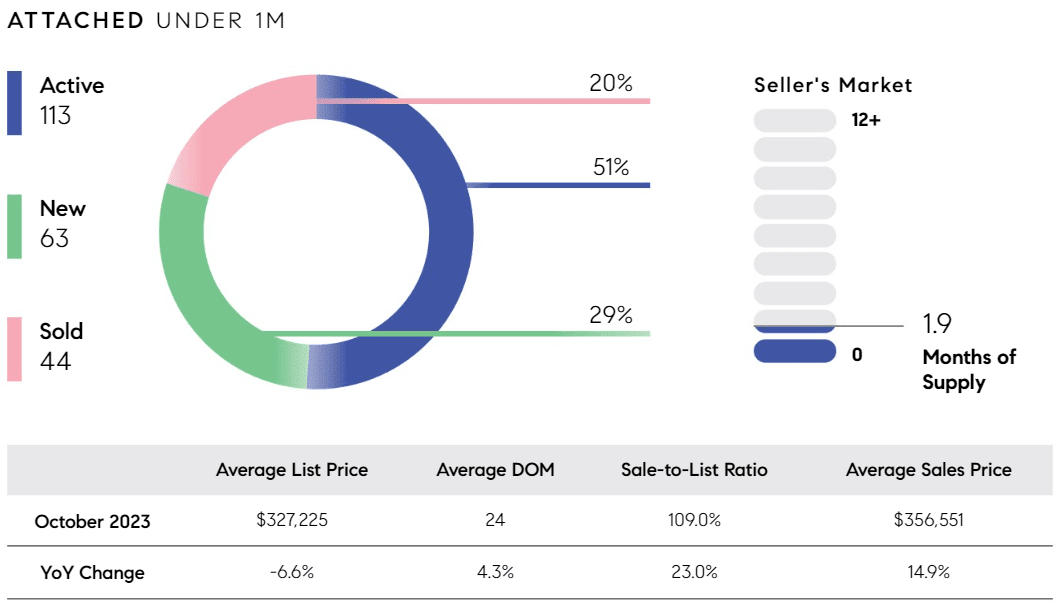
October 2023 market infographic for attached homes under $1 million, with listing, pricing, and supply statistics.


Acworth

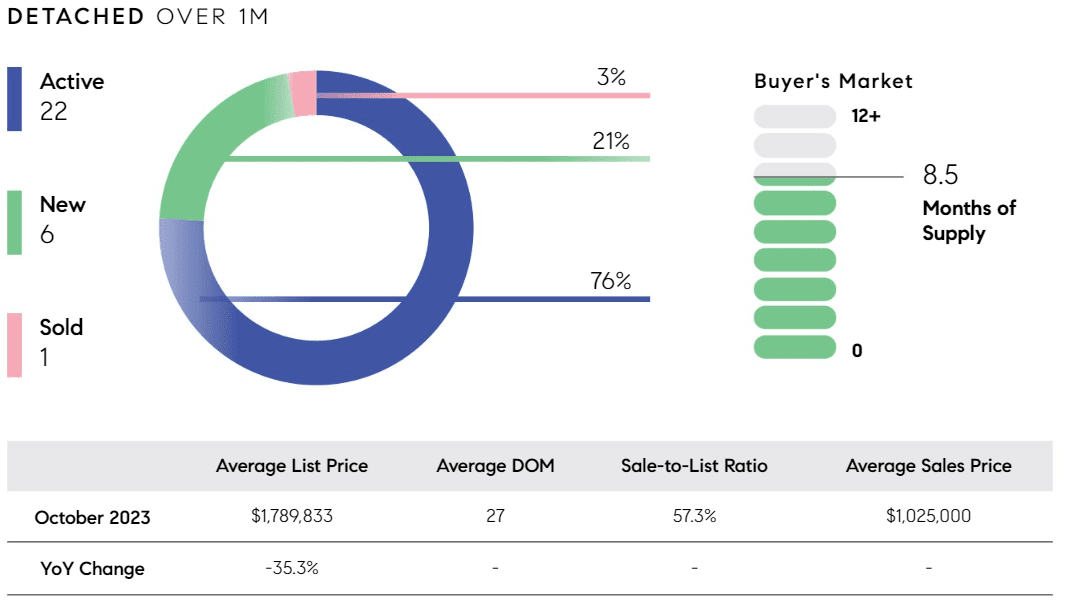
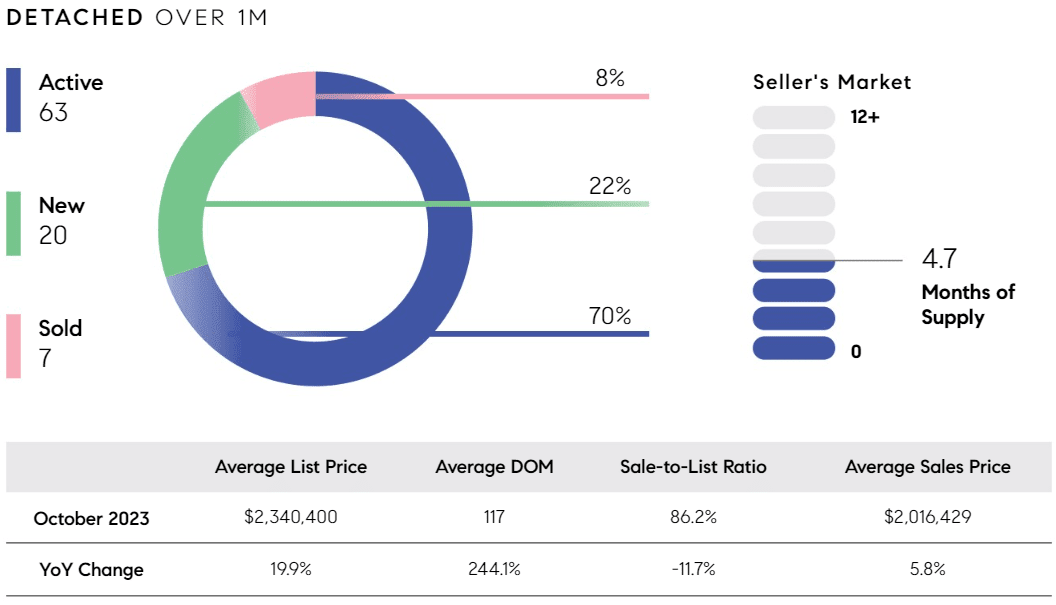
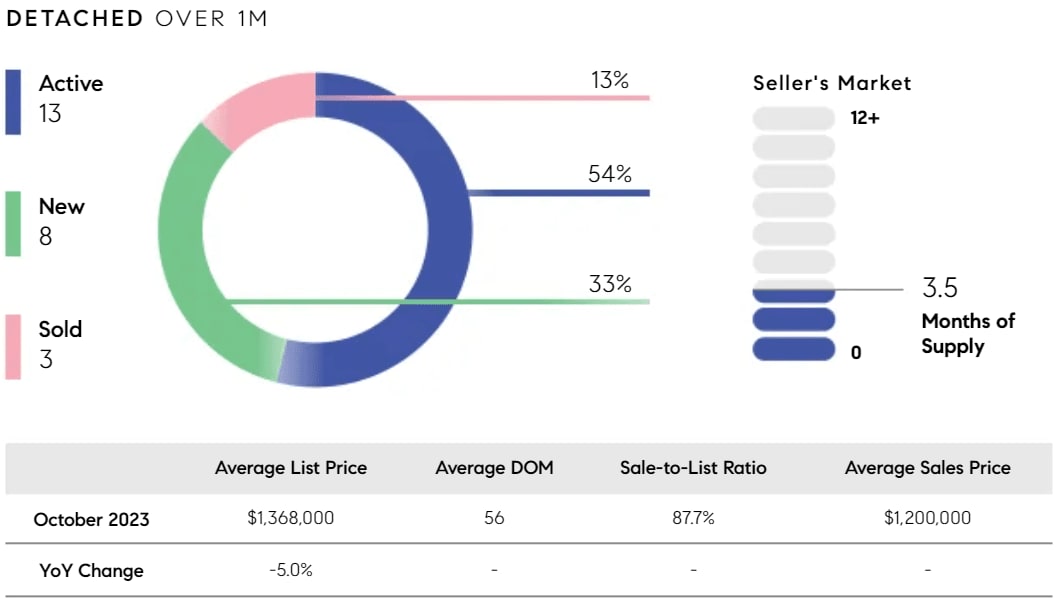
October 2023 market chart for detached homes over $1 million, with listing status, months of supply, and price statistics.


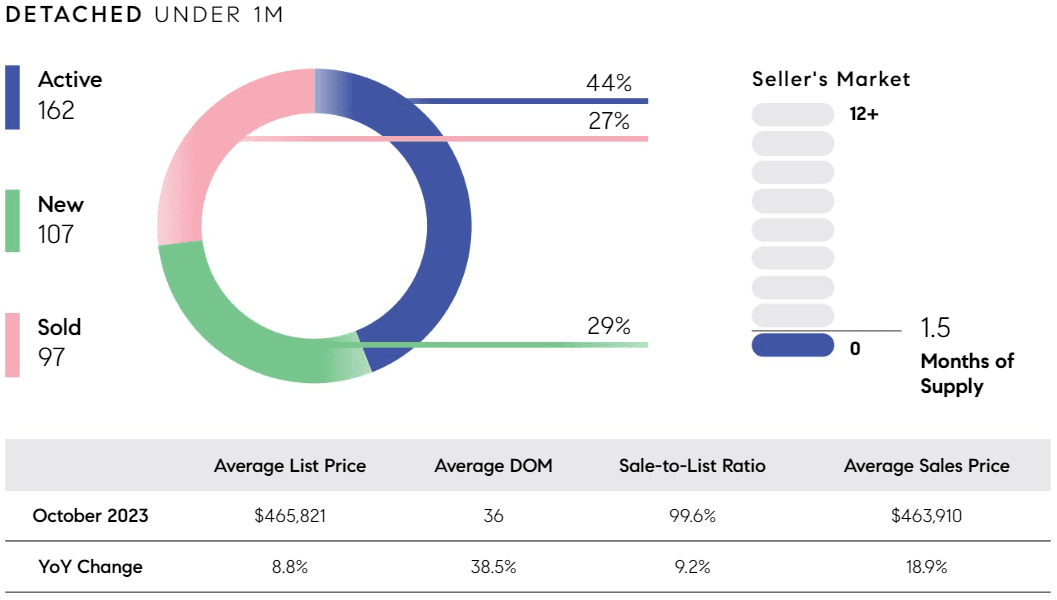
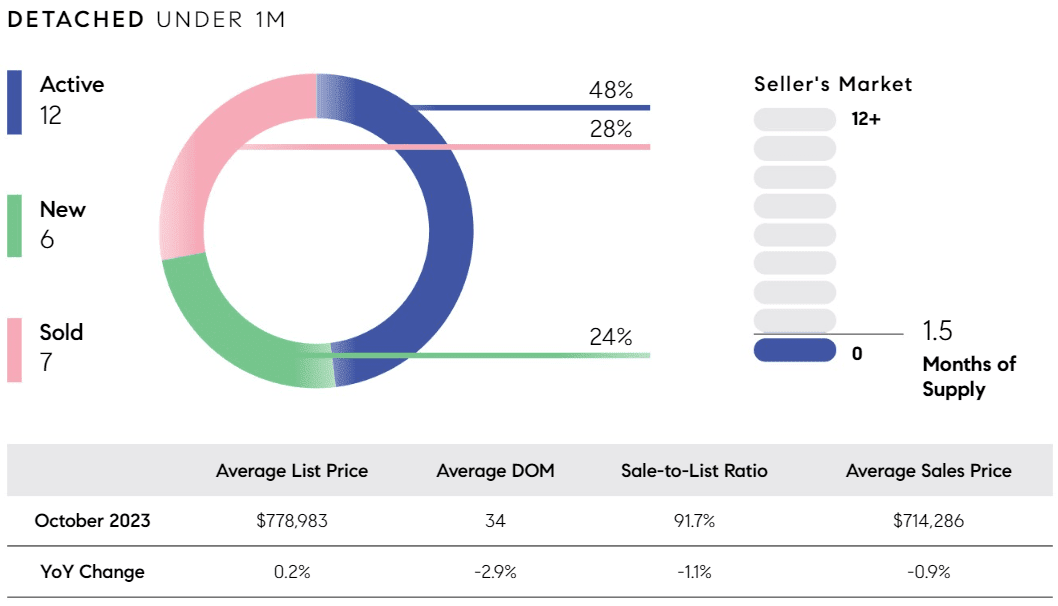
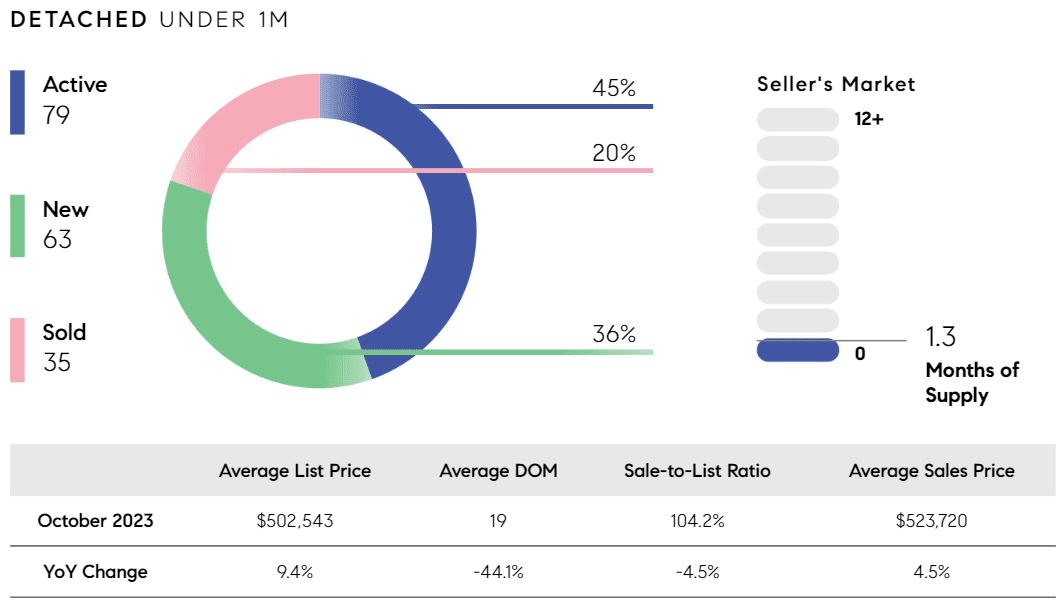
October 2023 detached-home market infographic showing listing counts, 1.5 months of supply, and prices.


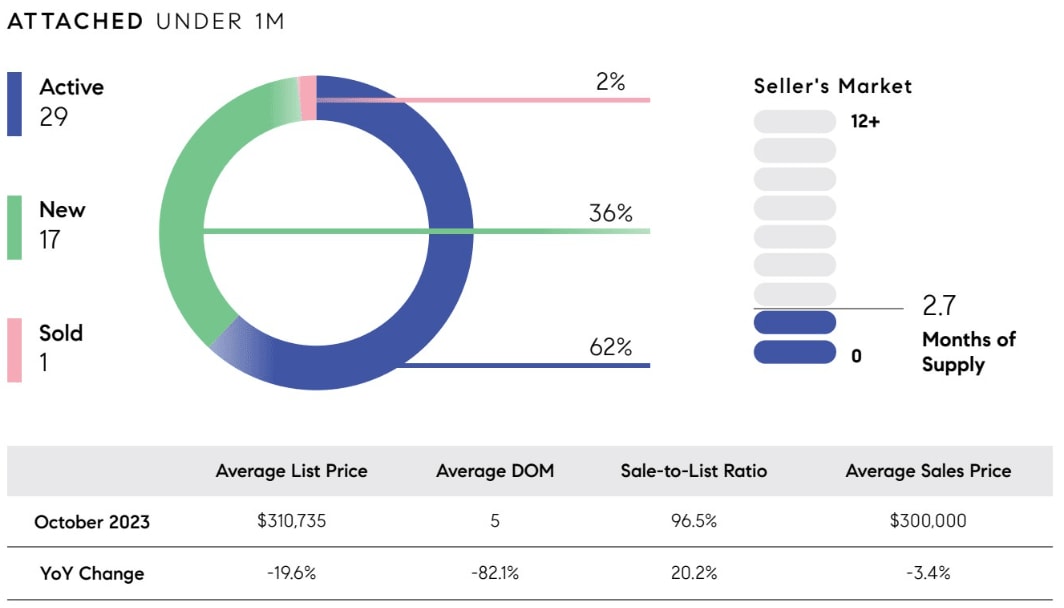
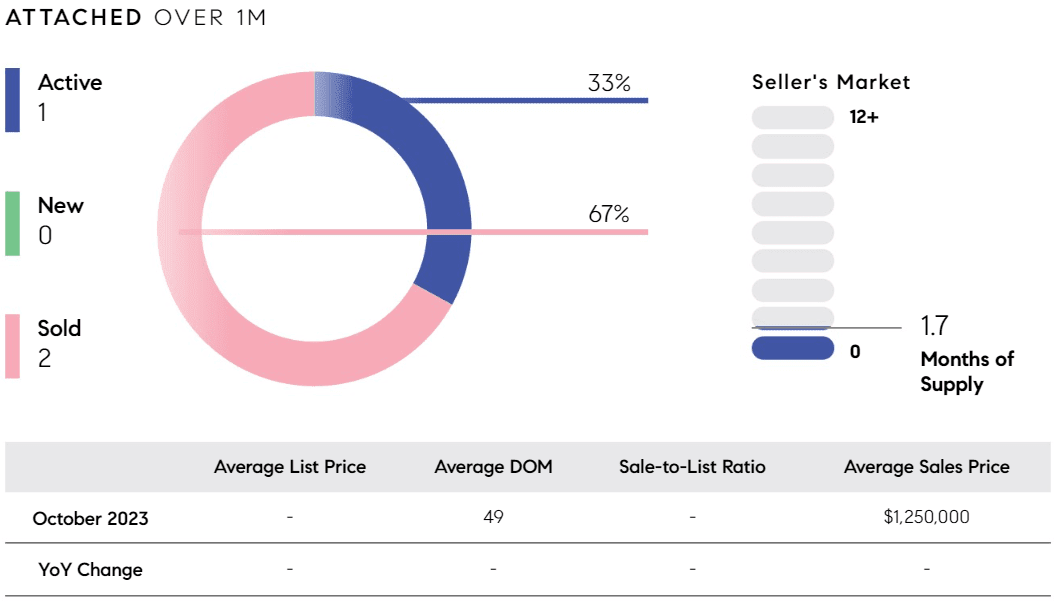
October 2023 attached-home market infographic with prices, sales activity, and months of supply.


Alpharetta

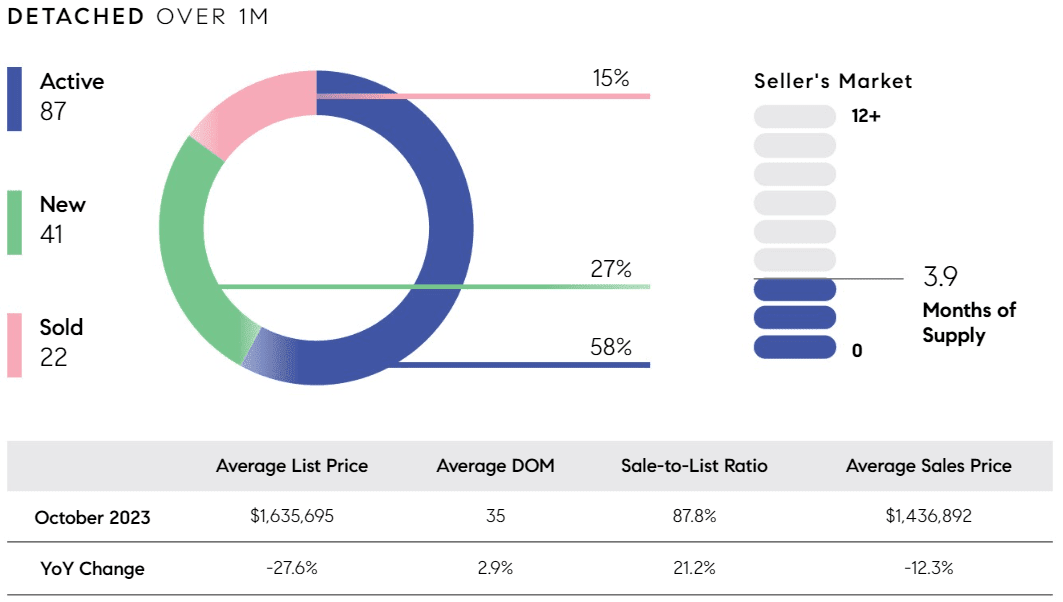
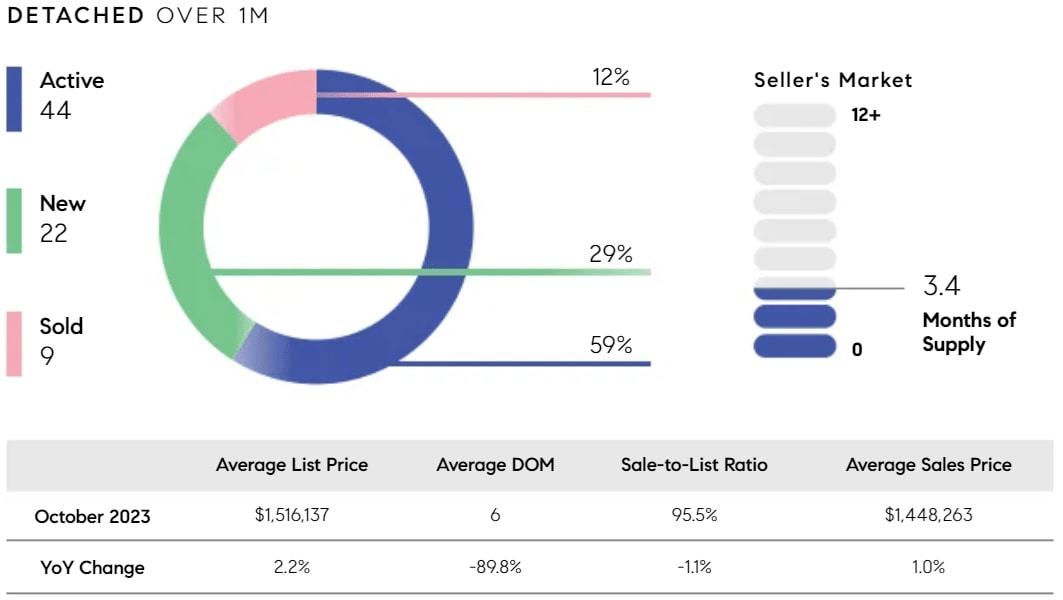
October 2023 market infographic for detached homes over $1 million, with listing counts, prices, and 3.9 months of supply.


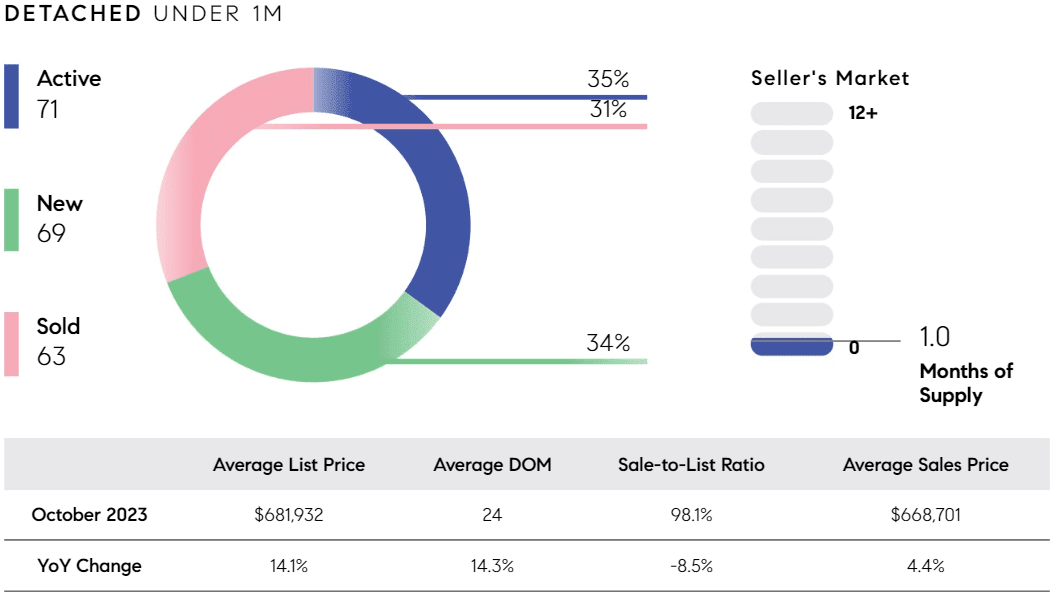
October 2023 market chart for detached homes under $1 million, including listing counts, prices, and 1.0 months of supply.


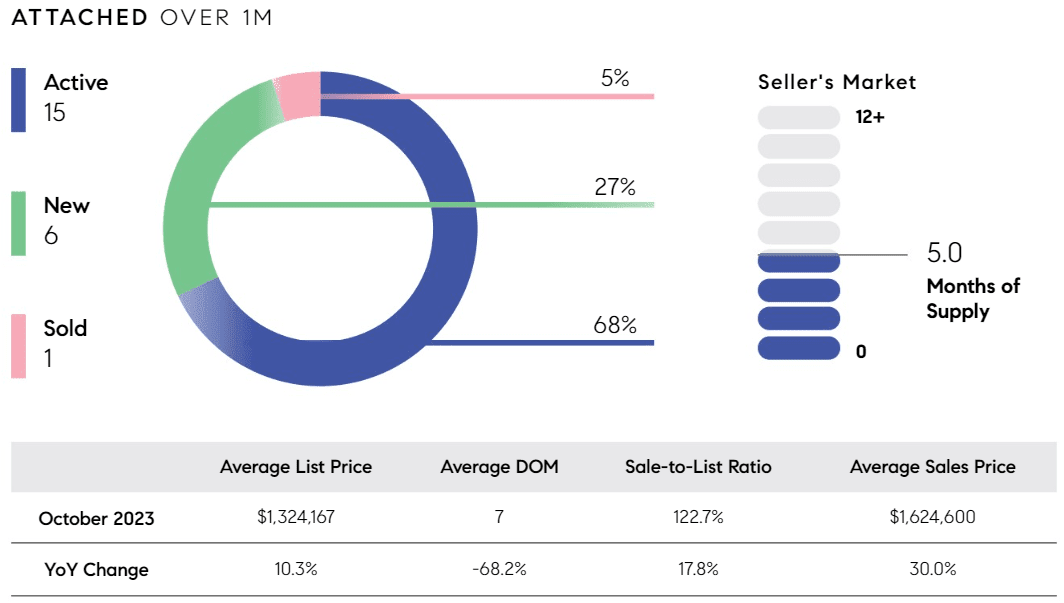
October 2023 real estate market infographic: 15 active, 6 new, 1 sold, 5.0 months of supply, and market price statistics.


Cumming

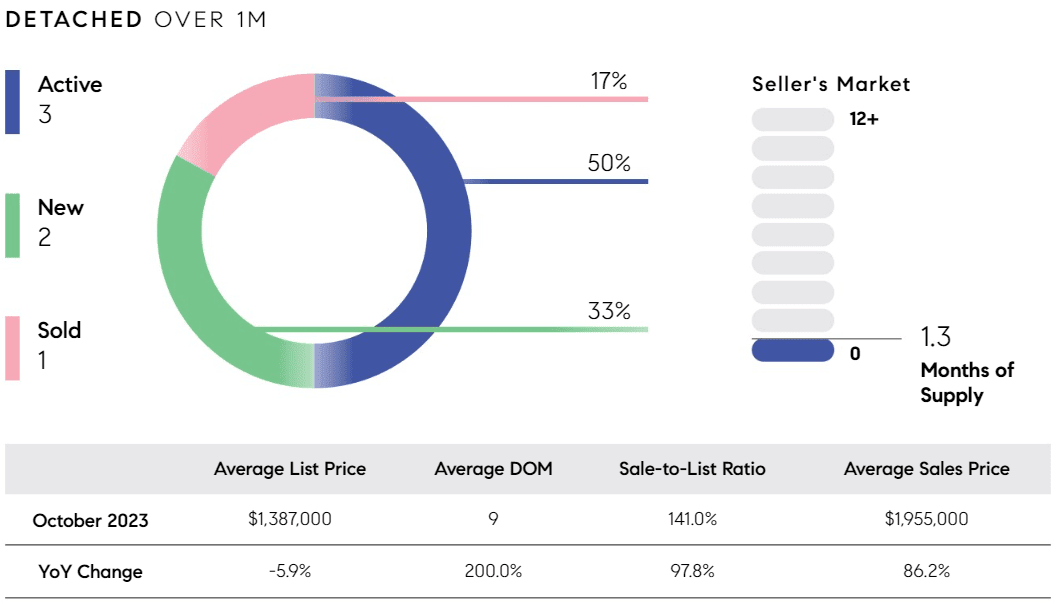
October 2023 market infographic for detached homes over $1 million, with listing, sale, price, and supply statistics.


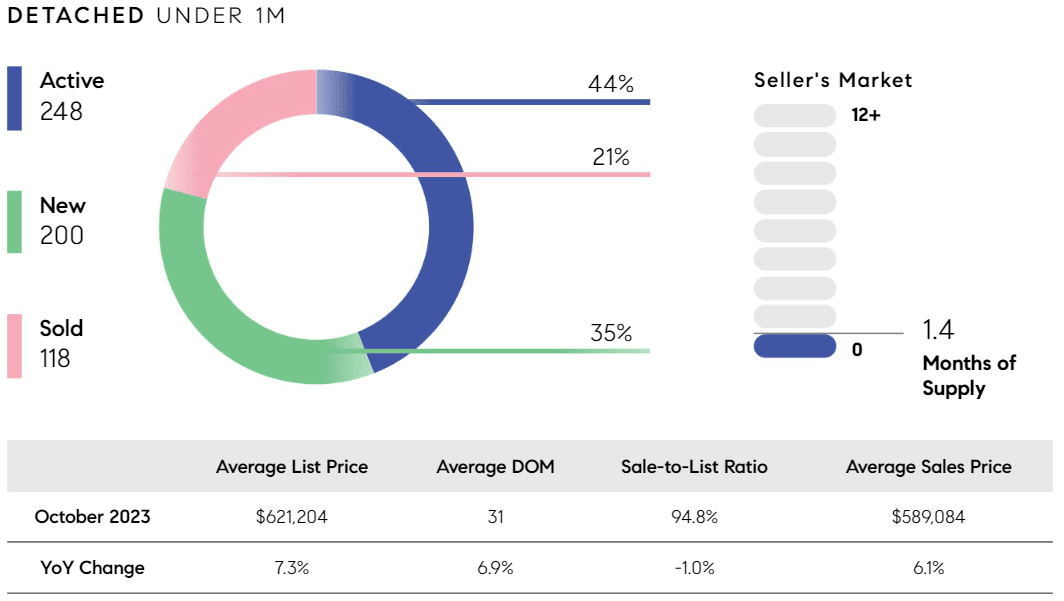
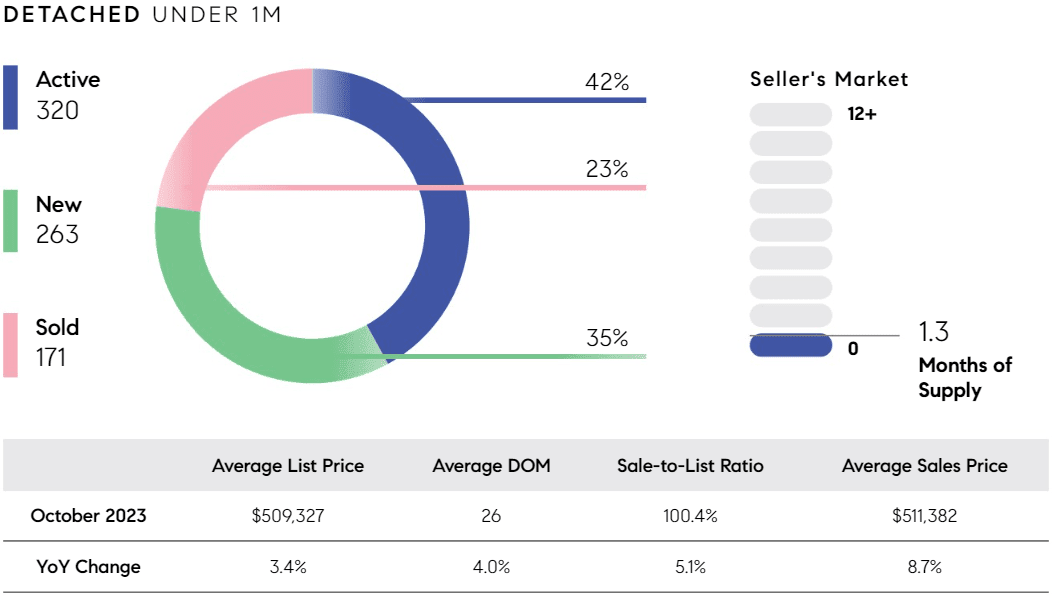
October 2023 Atlanta homes under $1M: 248 active, 200 new, 118 sold, and 1.4 months' supply.


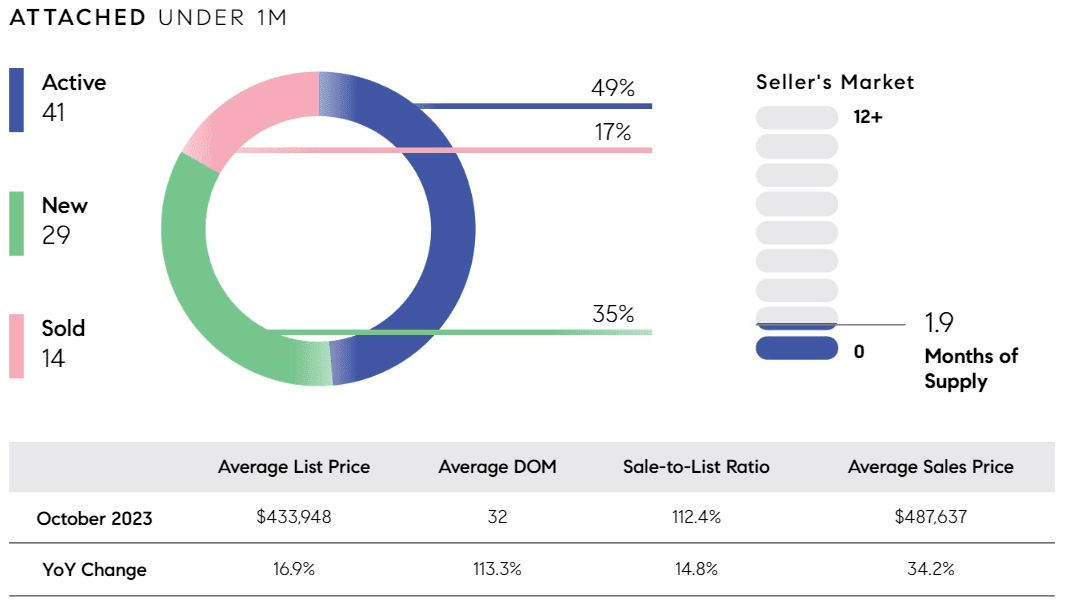
October 2023 attached-home market infographic with listing counts, 1.9 months of supply, and price and sales statistics.


Dunwoody

October 2023 market chart for detached homes over $1 million, with listing activity, months of supply, and price statistics.


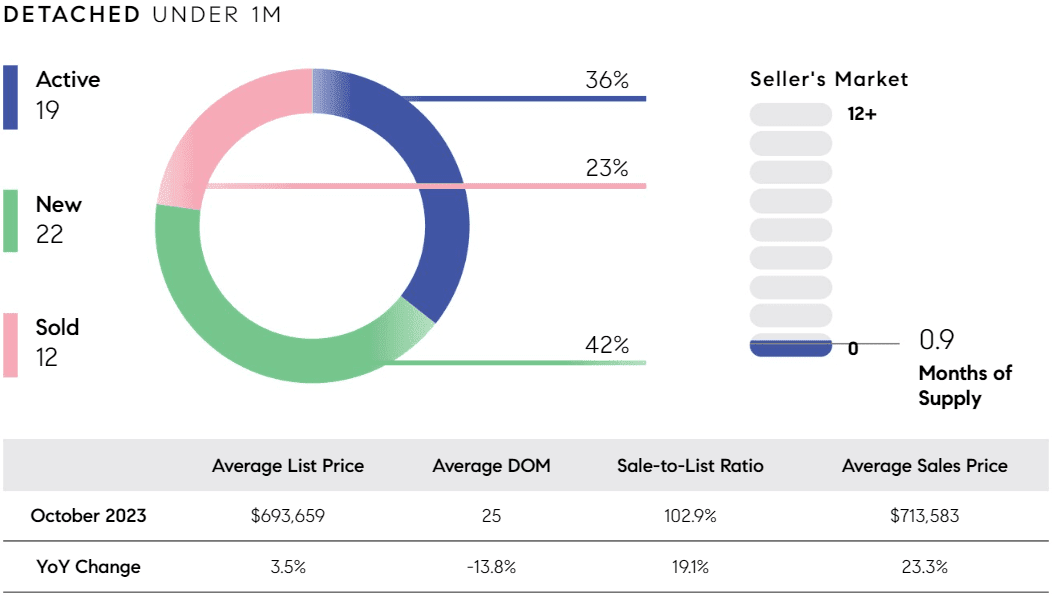
October 2023 detached-under-$1-million market chart with listing counts, months of supply, and sales statistics.


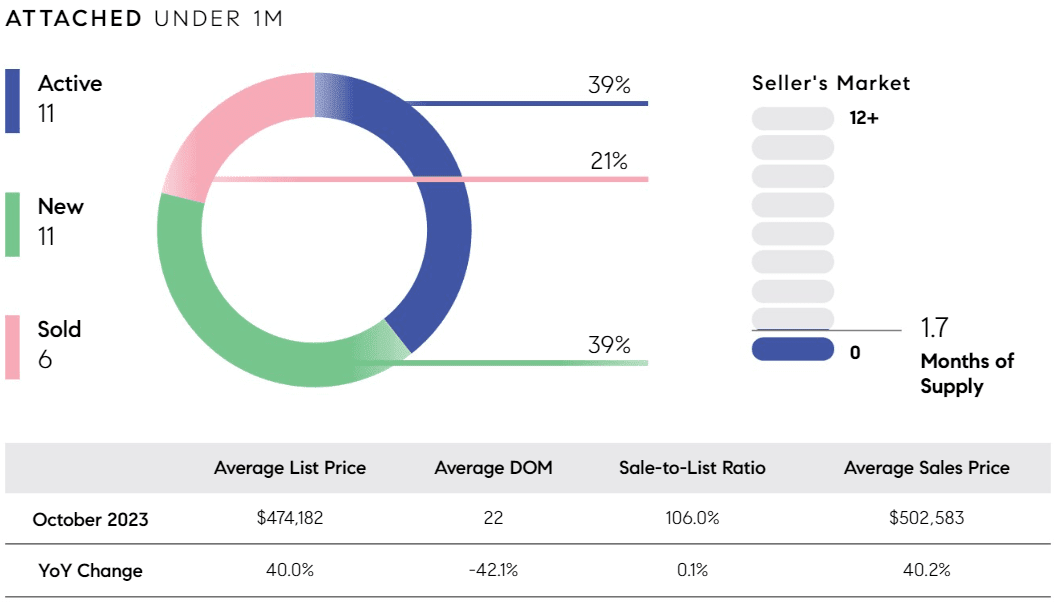
October 2023 market infographic: 11 active, 11 new, 6 sold; average sale price $502,583 and 1.7 months of supply.


East Cobb

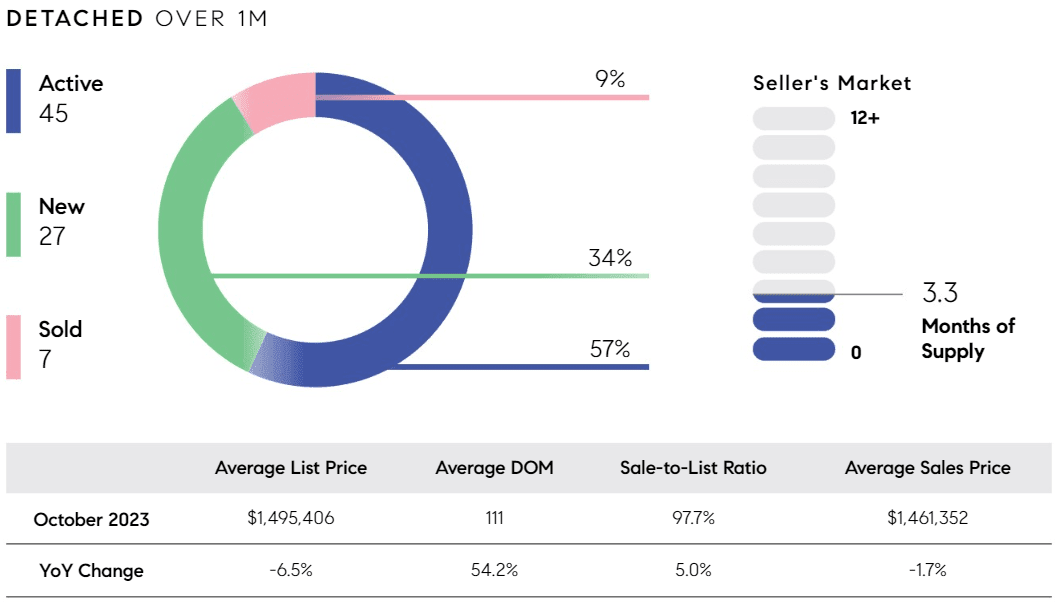
October 2023 market statistics for detached homes over $1 million, including listing activity, prices, and 3.3 months of supply.


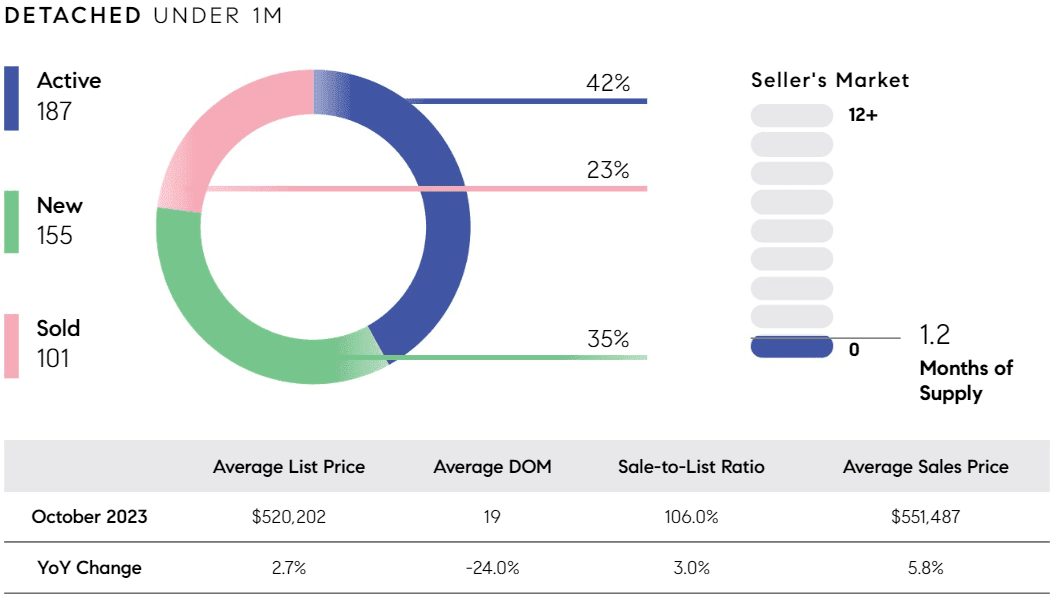
October 2023 detached-home market infographic with listing counts, a donut chart, months of supply, and pricing statistics.


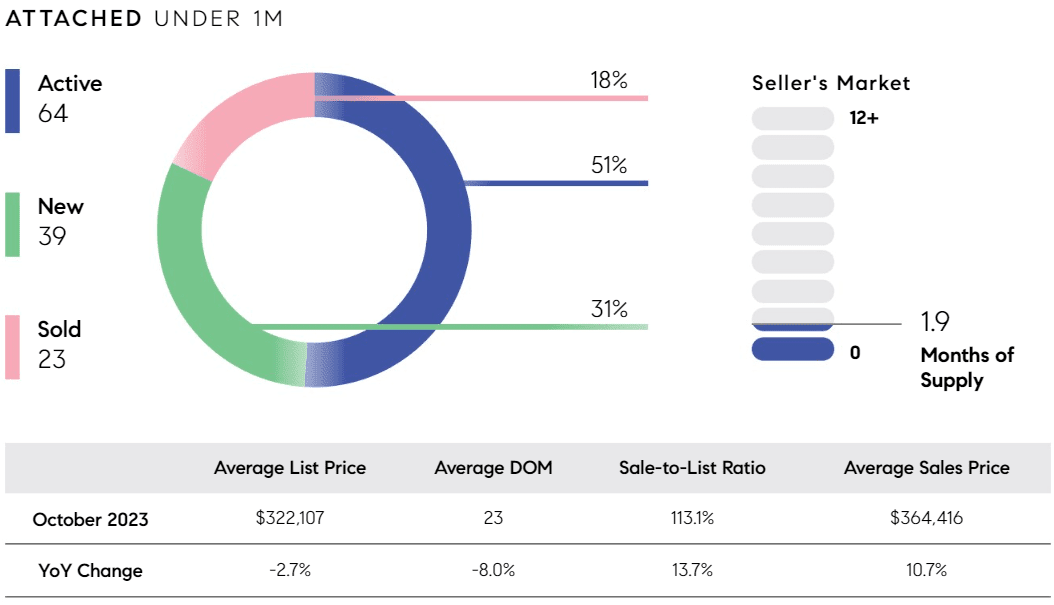
October 2023 real estate market chart with listing counts, prices, days on market, and months of supply.


Kennesaw

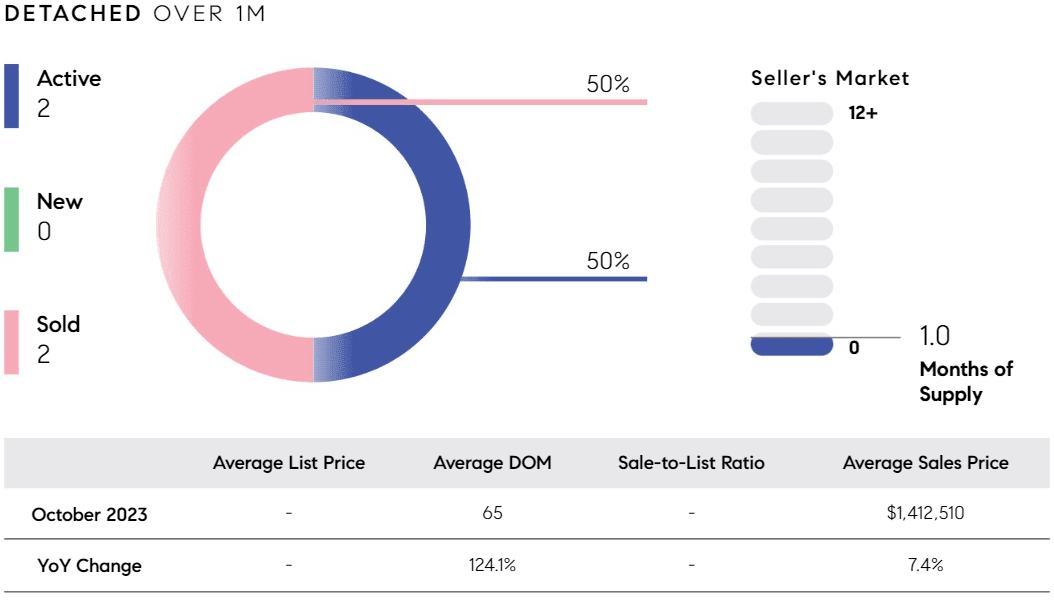
October 2023 market infographic for detached homes over $1 million, showing listing counts, days on market, and sales price.


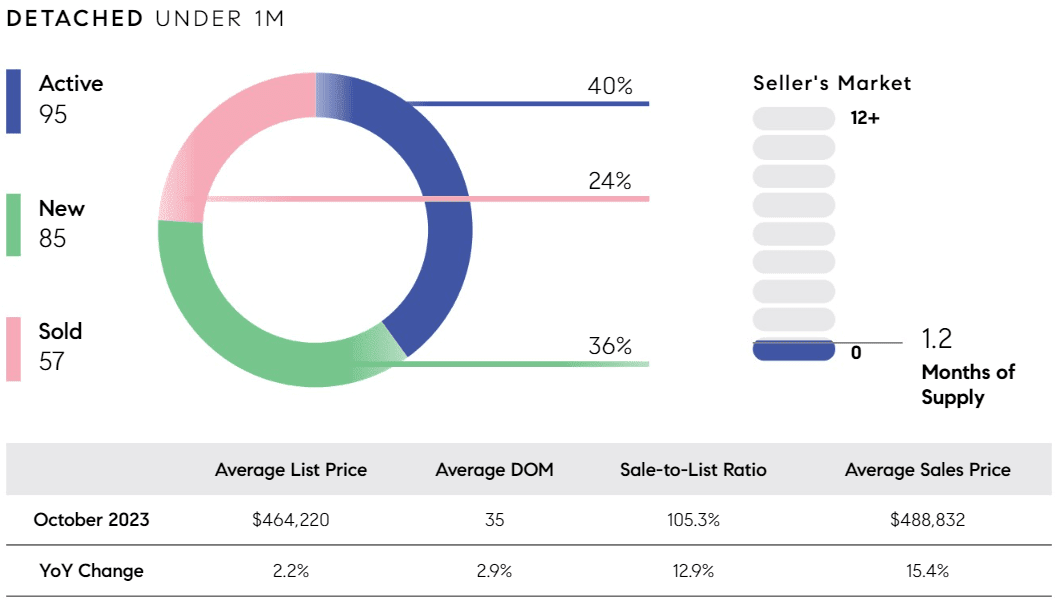
October 2023 detached-home market chart showing listing counts, 1.2 months of supply, and average sale price of $488,832.


October 2023 Atlanta-area real estate market infographic with listing counts, market supply, and pricing statistics.


Marietta

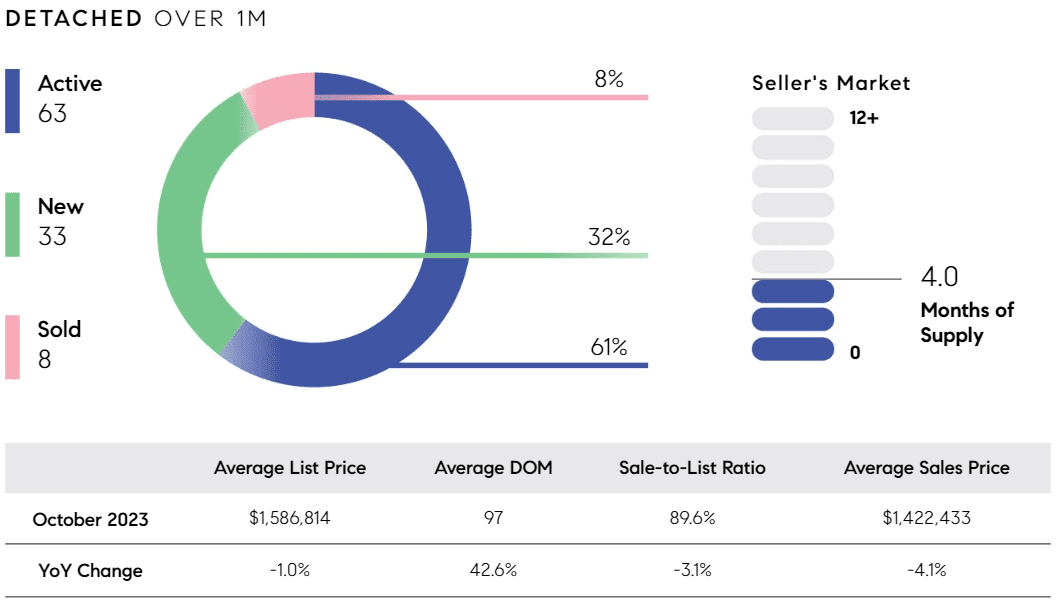
October 2023 market infographic for detached homes over $1 million: 63 active, 33 new, 8 sold, and 4.0 months of supply.


October 2023 detached-home market infographic with listing activity, market supply, prices, and year-over-year changes.


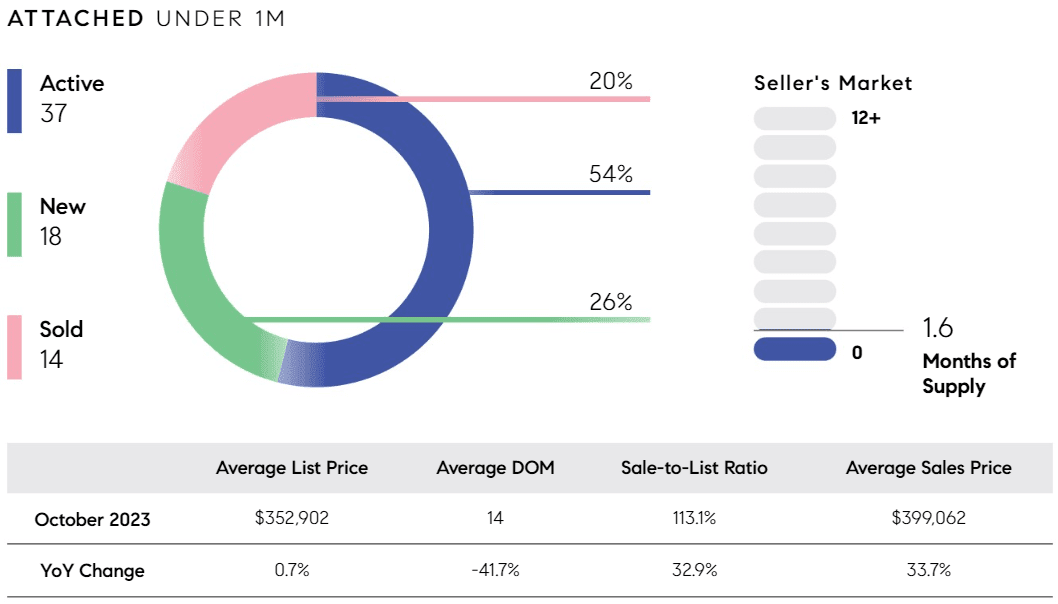
October 2023 attached-under-$1M market chart with listing counts, 1.9 months of supply, prices, and year-over-year changes.


Milton

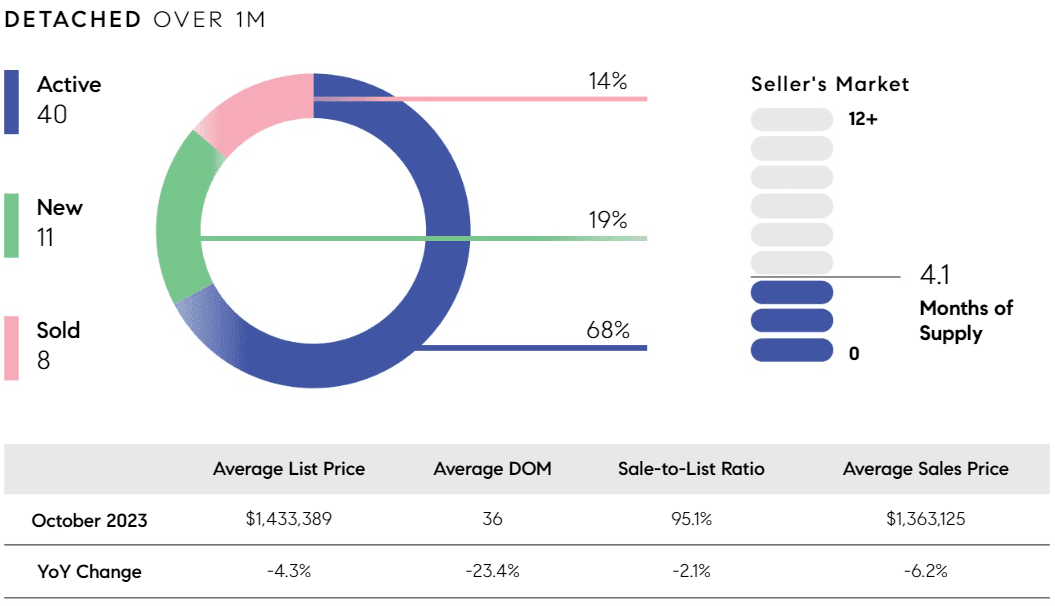
October 2023 market infographic for detached homes over $1 million, with inventory, months of supply, prices, and year-over-year changes.


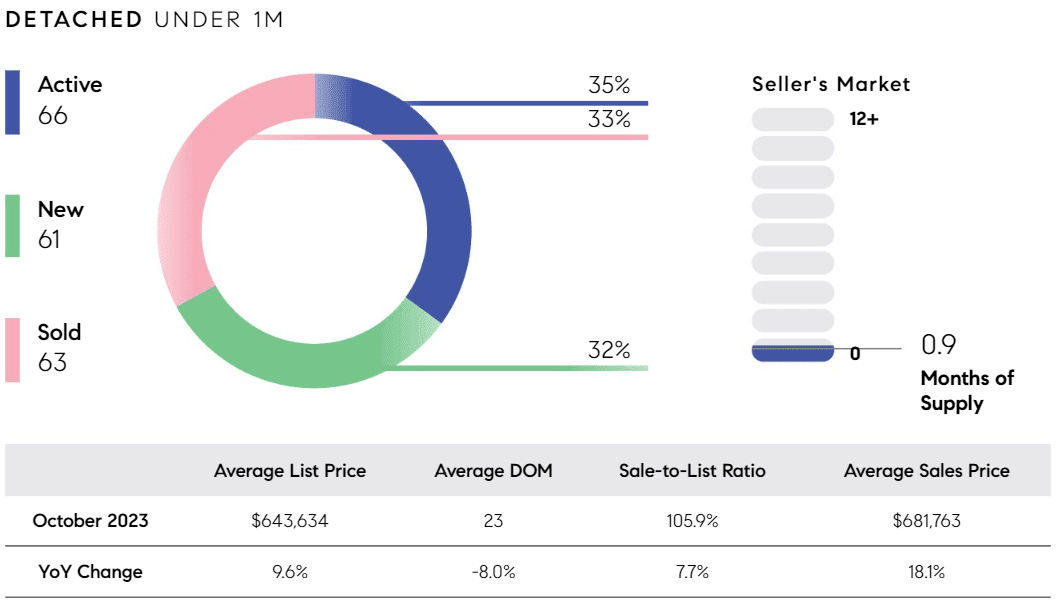
October 2023 market infographic for detached homes under $1 million, with listing, sales, pricing, and supply statistics.


October 2023 market infographic: 1 active, 0 new, 2 sold; 49 average days on market and $1,250,000 average sales price.


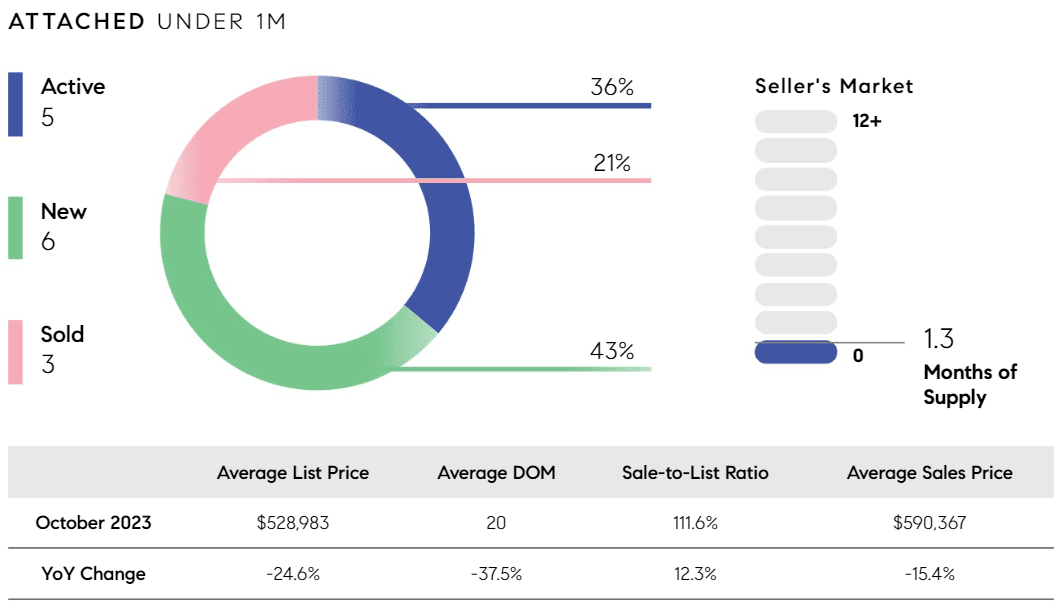
October 2023 attached-home market: 5 active, 6 new, 3 sold; average sales price $590,367.


Roswell

October 2023 market infographic for detached homes over $1 million, with listing counts, prices, and market statistics.


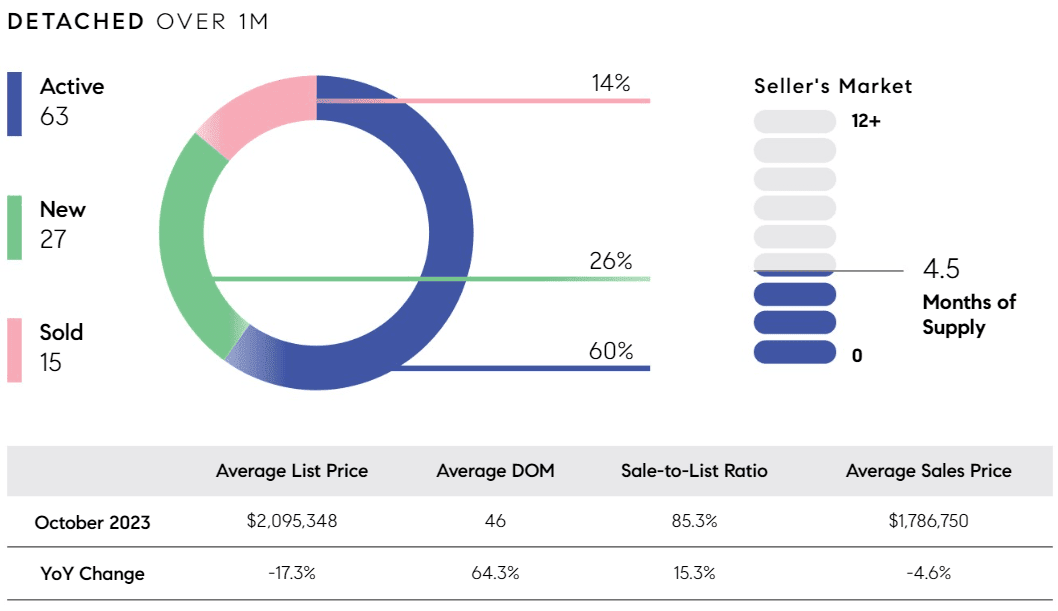
October 2023 detached-home market infographic with listing counts, months of supply, prices, and year-over-year changes.


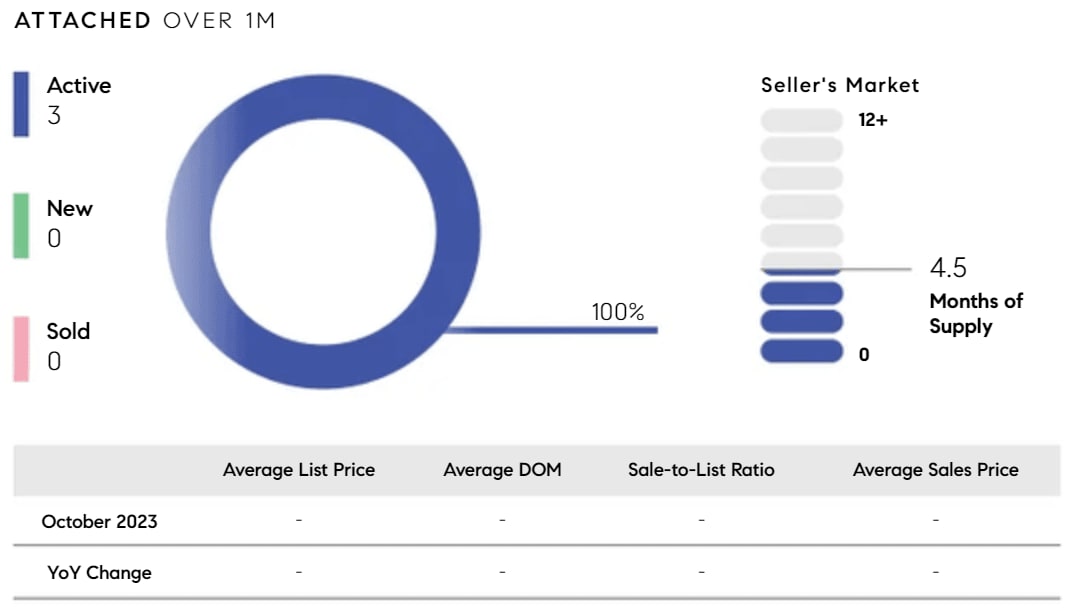
October 2023: 3 active listings, 0 new or sold, 4.5 months of supply.


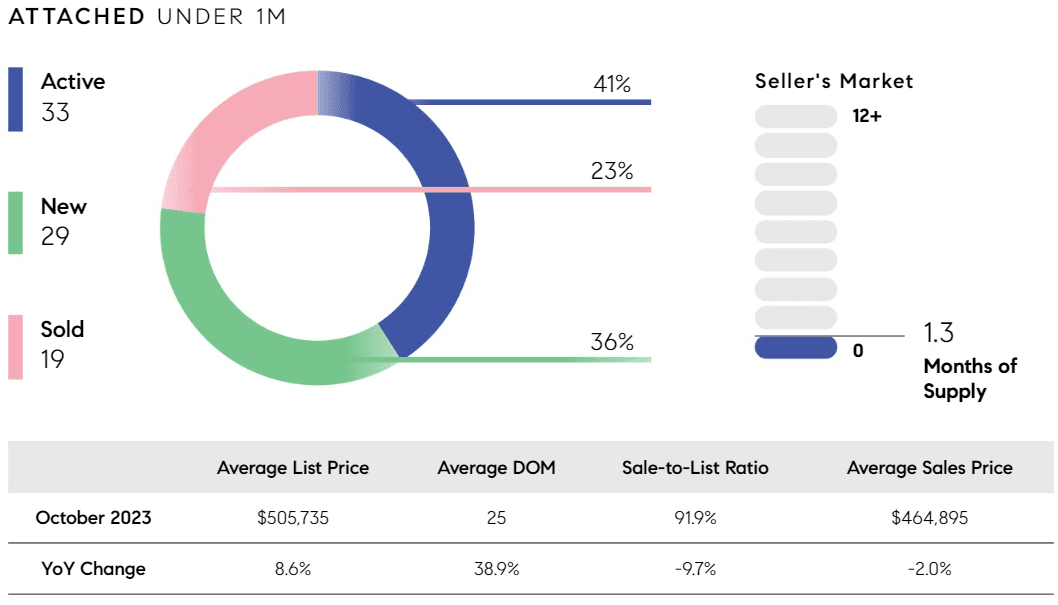
October 2023 attached-home market infographic: 33 active, 29 new, 19 sold; 1.3 months of supply and $464,895 average sale price.


Sandy Springs

October 2023 market infographic for detached homes over $1 million, with listing counts, market supply, and pricing statistics.


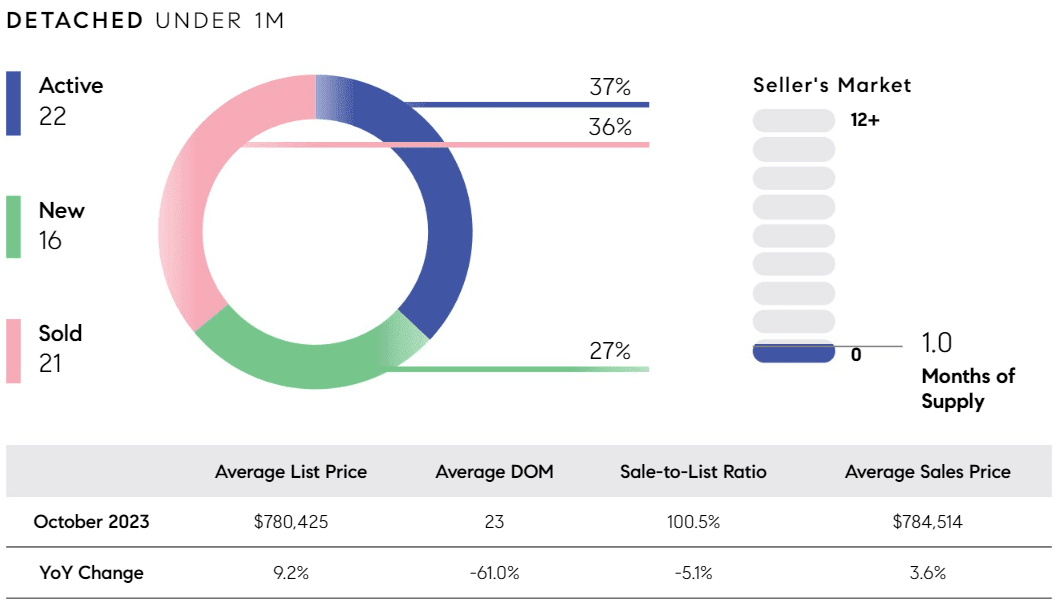
October 2023 detached homes under $1 million: 22 active, 16 new, 21 sold, and 1.0 month of supply.


October 2023 market chart for homes under $1 million, with listing activity, prices, days on market, and months of supply.


Smyrna

October 2023 market statistics for detached homes over $1 million, including prices, listings, days on market, and supply.


October 2023 detached-home market infographic showing listing counts, prices, days on market, and 1.3 months of supply.


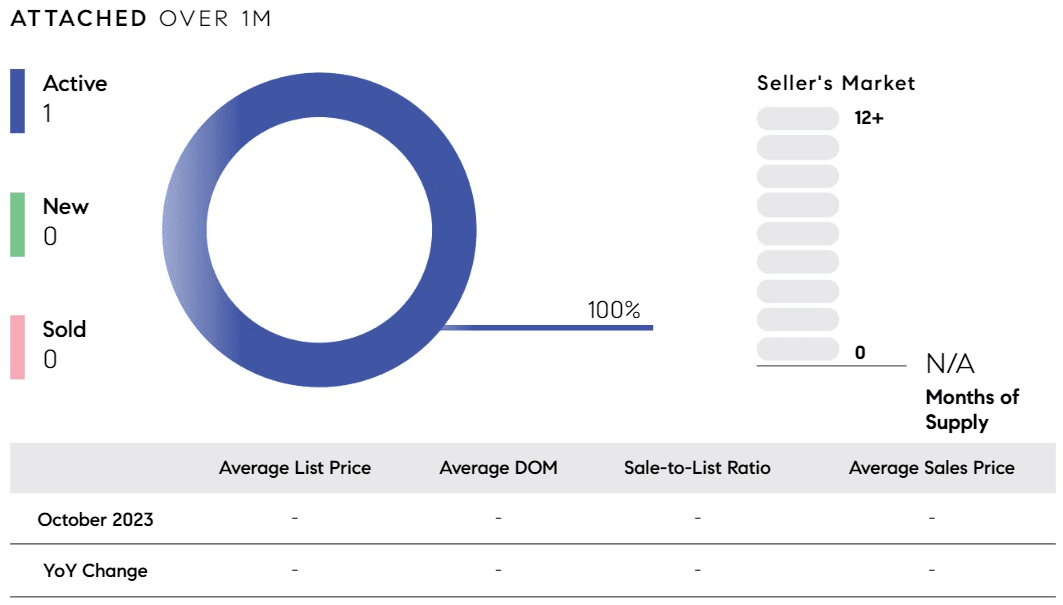
October 2023 real estate market infographic with one active listing, no new or sold listings, and a 100% chart.


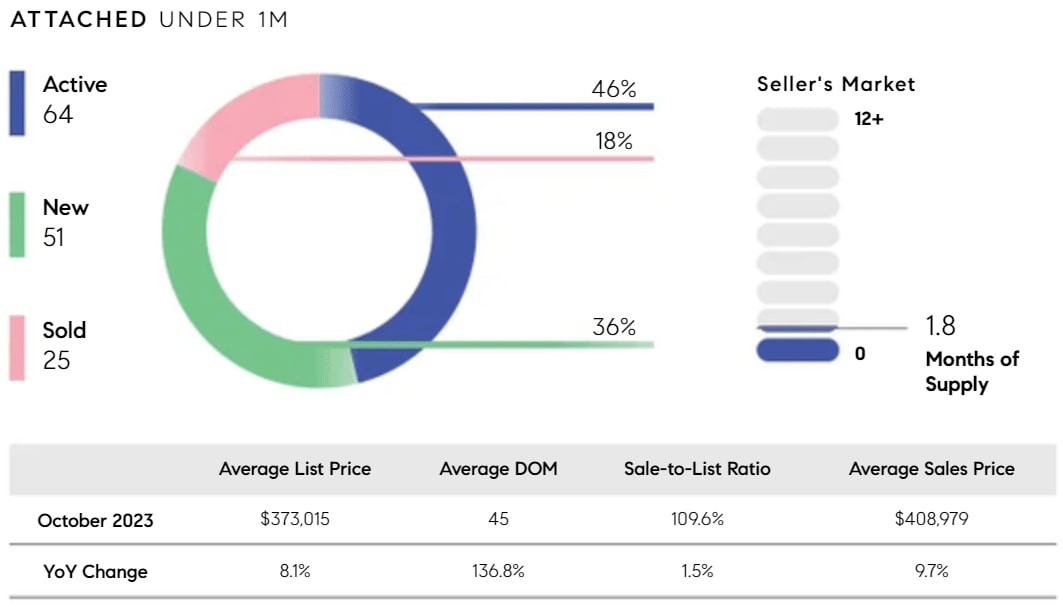
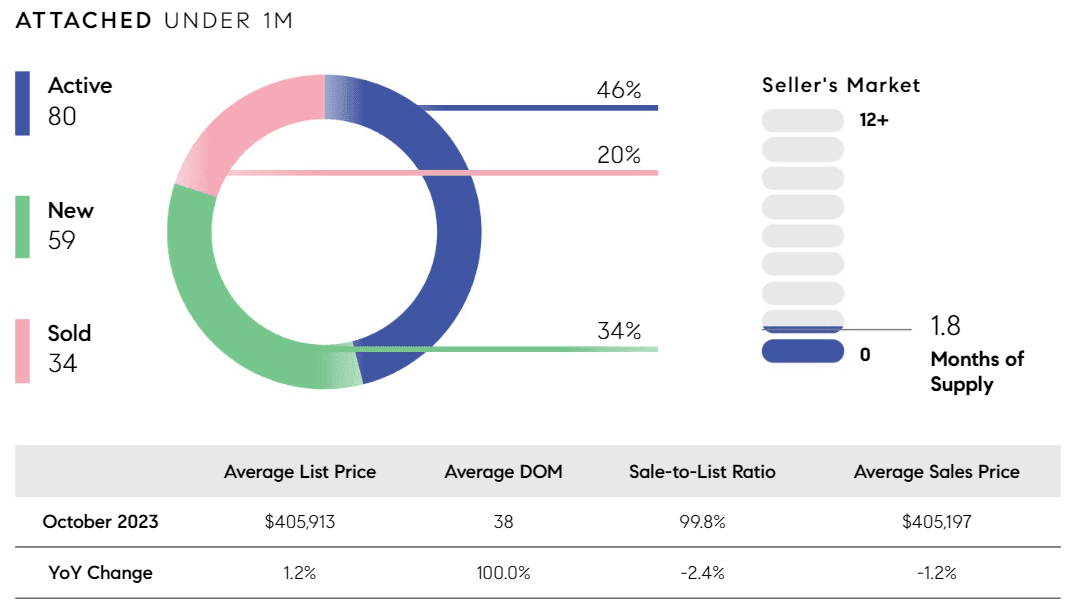
October 2023 attached-home market infographic with listing counts, 1.8 months of supply, and market statistics.


Vinings

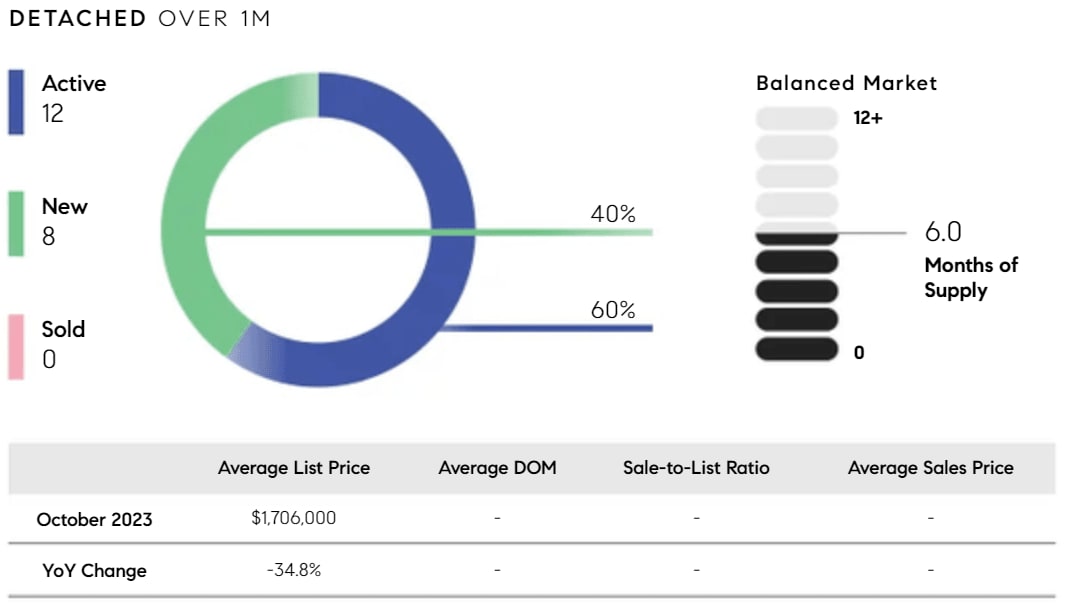
October 2023 market statistics for detached homes over $1 million: 12 active listings, 8 new, none sold, and 6 months of supply.


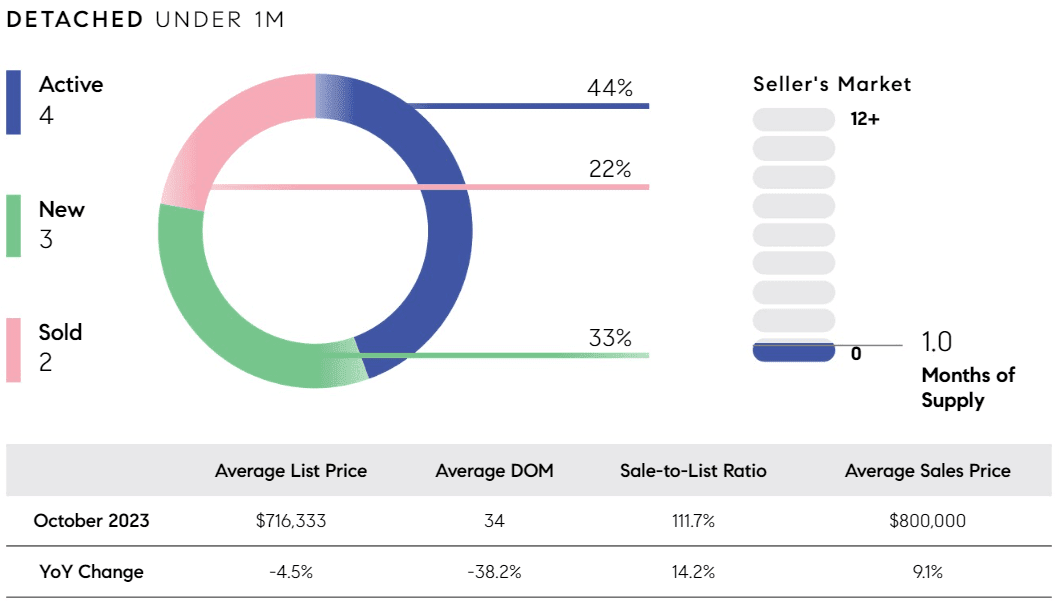
October 2023 detached-home market chart showing prices, sales, and one month of supply.


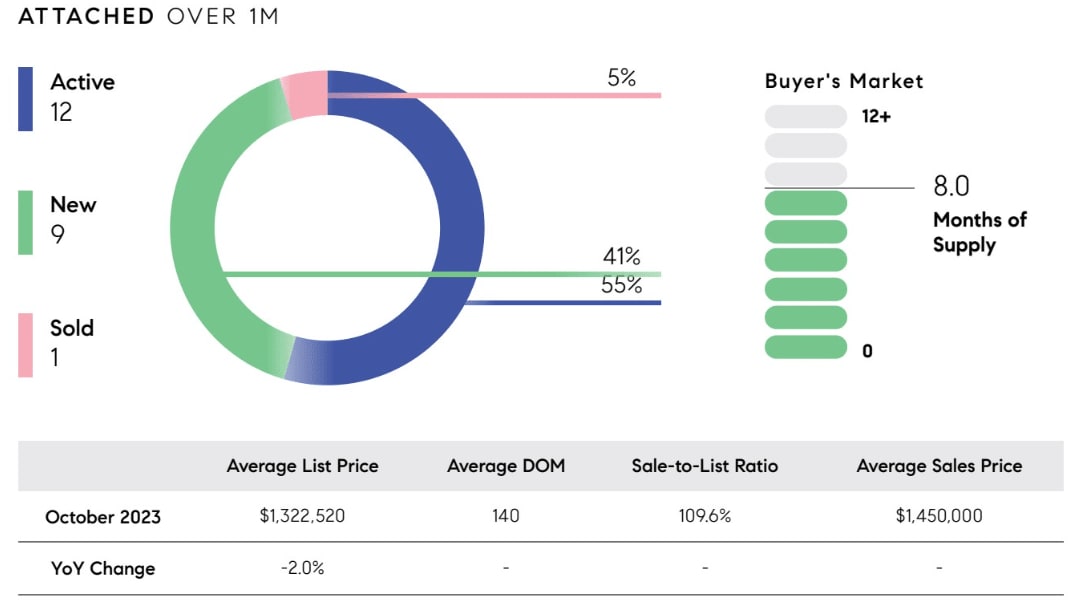
October 2023 attached-home market infographic: 12 active listings, 9 new, 1 sold, and 8 months of supply.


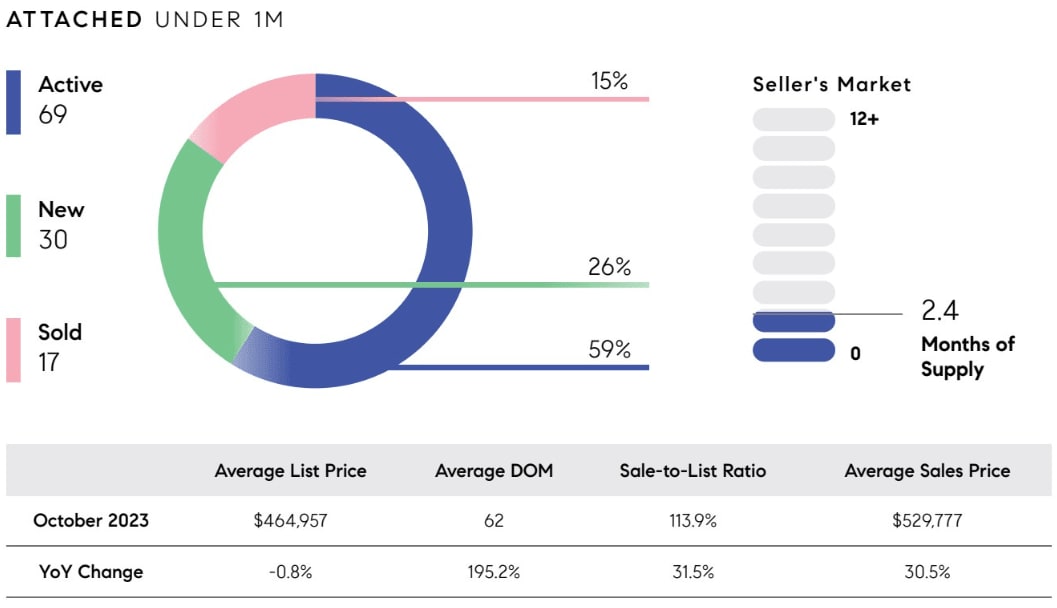
October 2023 real estate market infographic with listing counts, market shares, prices, days on market, and supply.


Woodstock

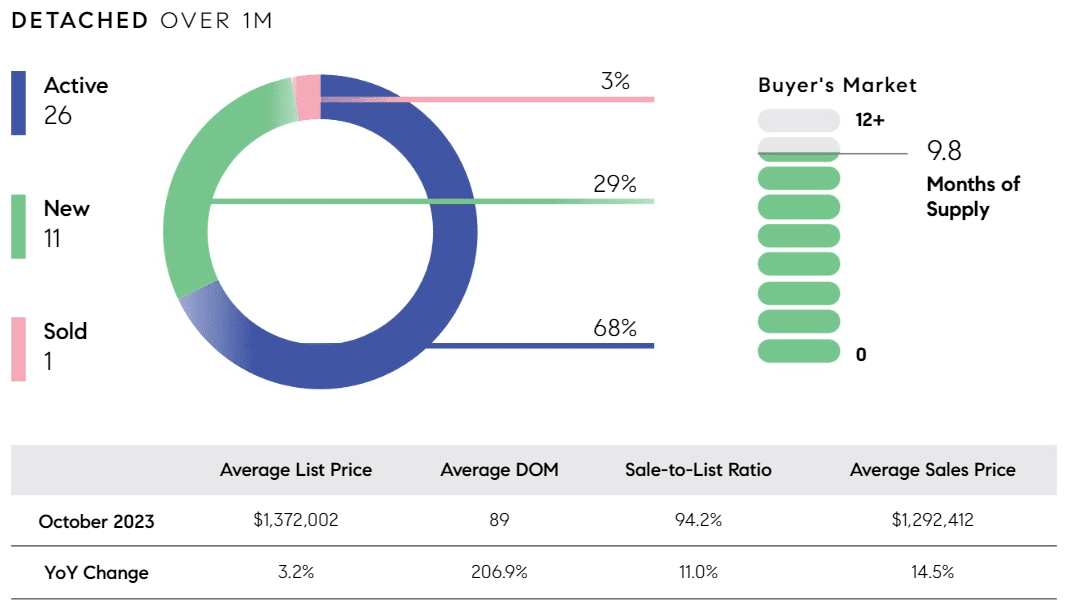
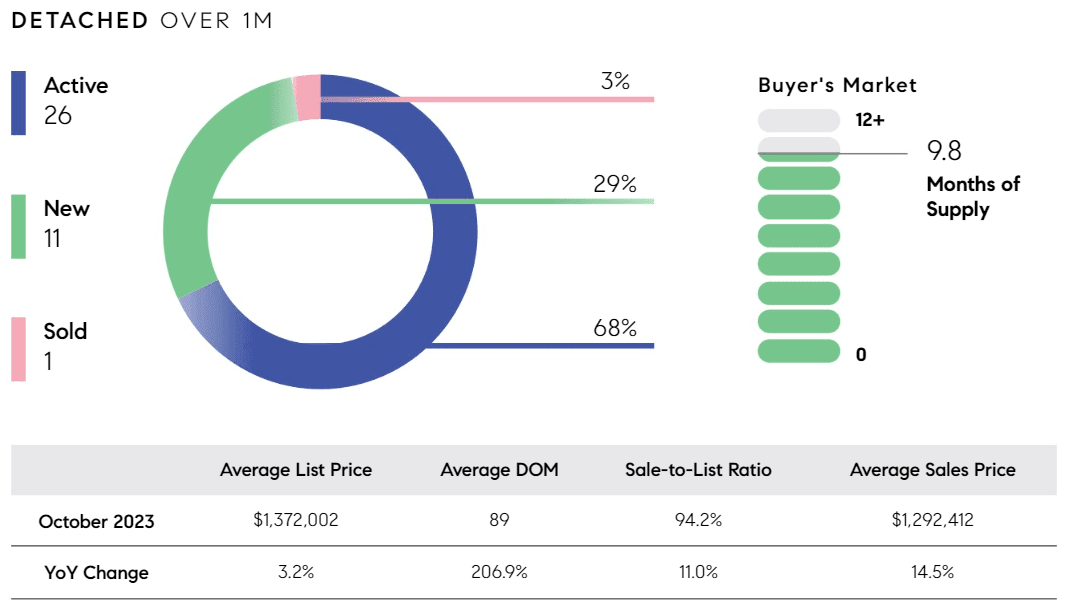
October 2023 market statistics for detached homes over $1 million, including prices, sales activity, and 9.8 months of supply.


October 2023 detached-home market infographic: 9.8 months of supply, average list price $1,372,002, and average sale price $1,292,412.


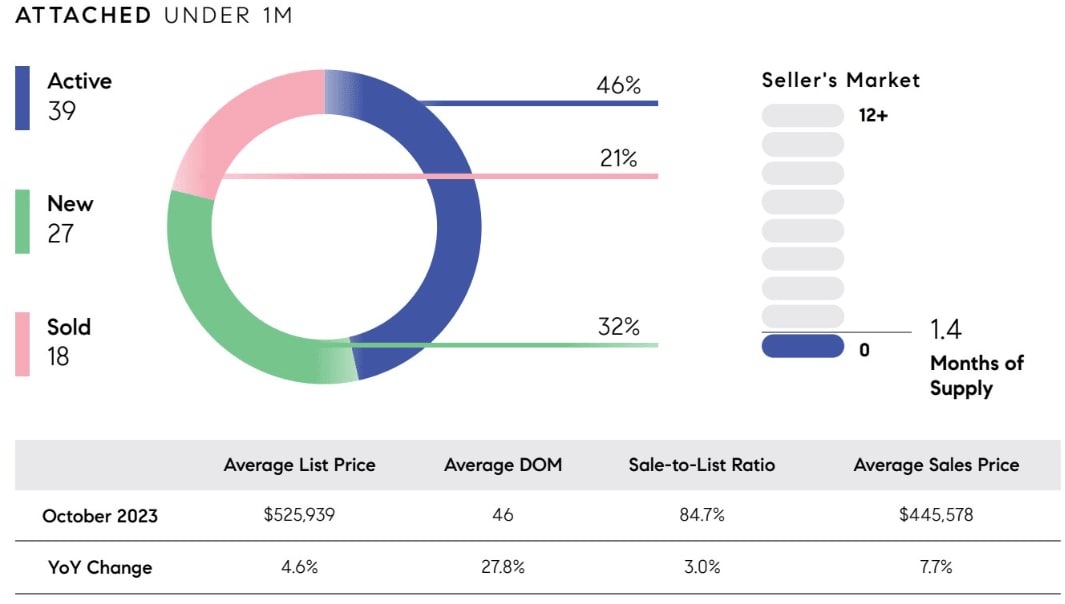
October 2023 real estate market infographic for attached homes under $1 million, with sales and pricing statistics.


The real estate landscape in Greater Atlanta and North Metro Area is ever-evolving. Check back to stay informed about the latest trends and opportunities. Whether you're considering buying, selling, or investing in a property, having a comprehensive understanding of the market dynamics is essential for making informed decisions.

If you have any questions or are considering making a real estate move in or around the Atlanta area, our team of experienced real estate advisors is here to provide personalized guidance and support tailored to your specific needs and goals.
 

Work With Us

Our approach to real estate is different though. We start with YOU. Your situation. Your goals. Your dreams. Based on your aspirations and our insights, expertise and connections in the real estate market.