In the first half of 2023, the national real estate market continued to recover strongly, bouncing back from the slowdown and price decline that hit its lowest point in late 2022. Despite intermittent financial crises, the macroeconomic indicators have generally turned positive, with significant improvements in stock markets, a major decrease in inflation, robust employment reports, and consumer confidence reaching its highest level since September 2021. Although interest rates remain relatively high, ranging from 6% to 7% this year, buyers seem to have accepted these rates as the new norm, and a larger proportion of buyers are making all-cash purchases.
Buyer demand has been on the rise during the spring, but sales have been constrained due to a sharp decrease in new property listings over the past 12 months. This decline is largely attributed to the "mortgage lock-in effect," where homeowners with low-interest rate mortgages are hesitant to sell and relocate. Consequently, this has led to an upward pressure on home prices and a surge in new-home construction, as developers take advantage of the low-inventory conditions.
In 2023, the market has increasingly favored sellers, with homes selling faster, receiving more offers, and fetching higher prices. While some of this is attributable to seasonal dynamics, as spring is typically the most active selling season, it also reflects a rebound in psychology, with many buyers deciding to move forward with their life plans.
It is important to note that a national report is a broad overview of trends across various regional submarkets, each with its own unique values and market dynamics. The data presented here does not apply to a specific home without a detailed comparative market analysis.
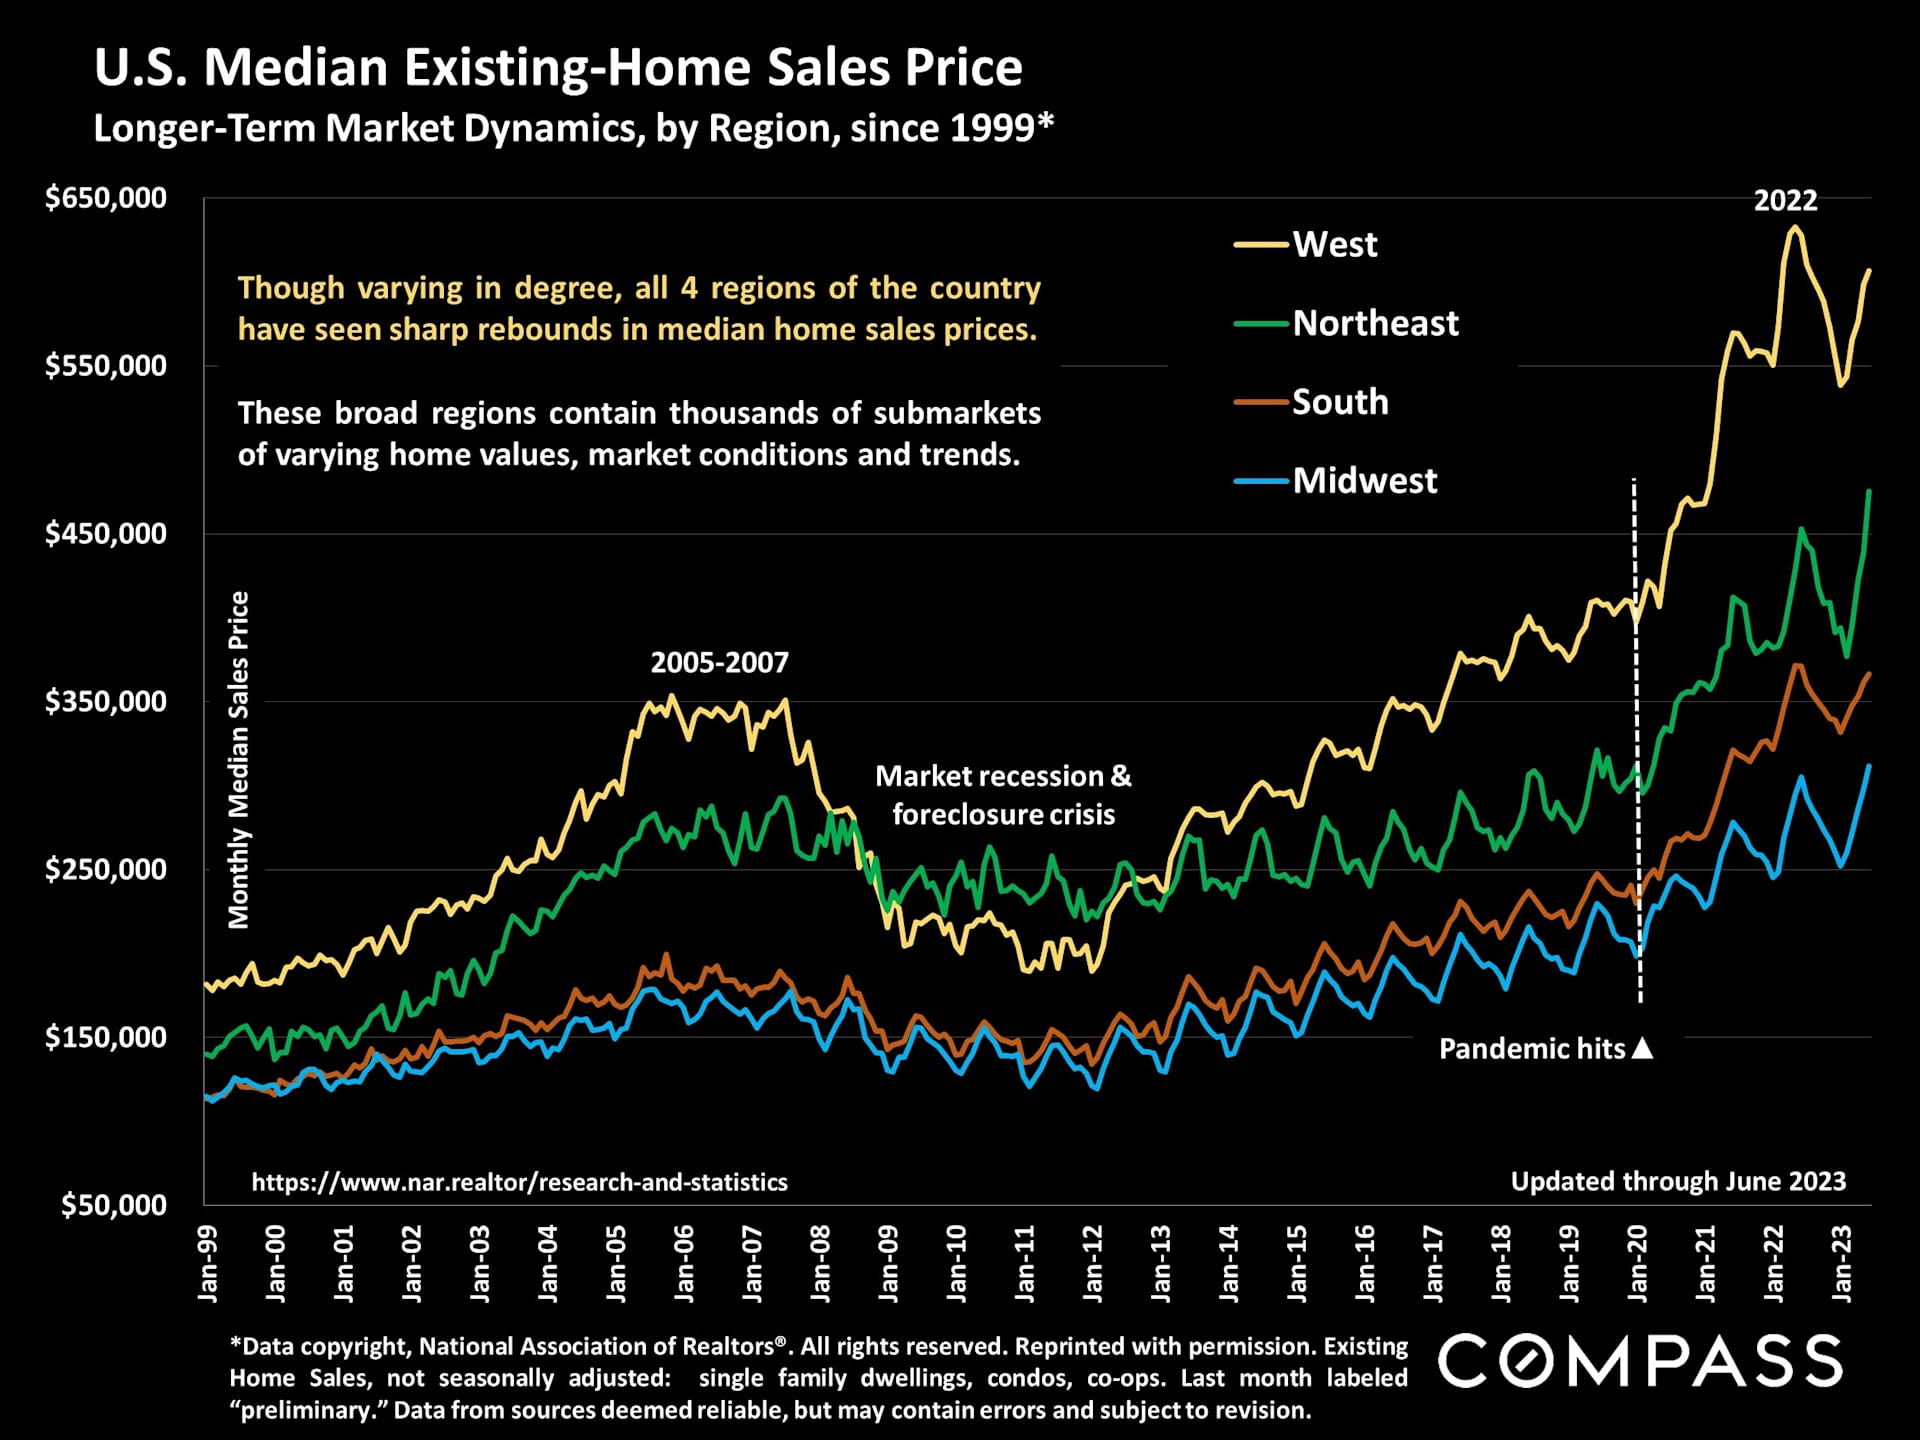
An illustration of long-term, national median home sales prices: The June 2023 price was just 1% lower than in June 2022, the historic peak of the market.
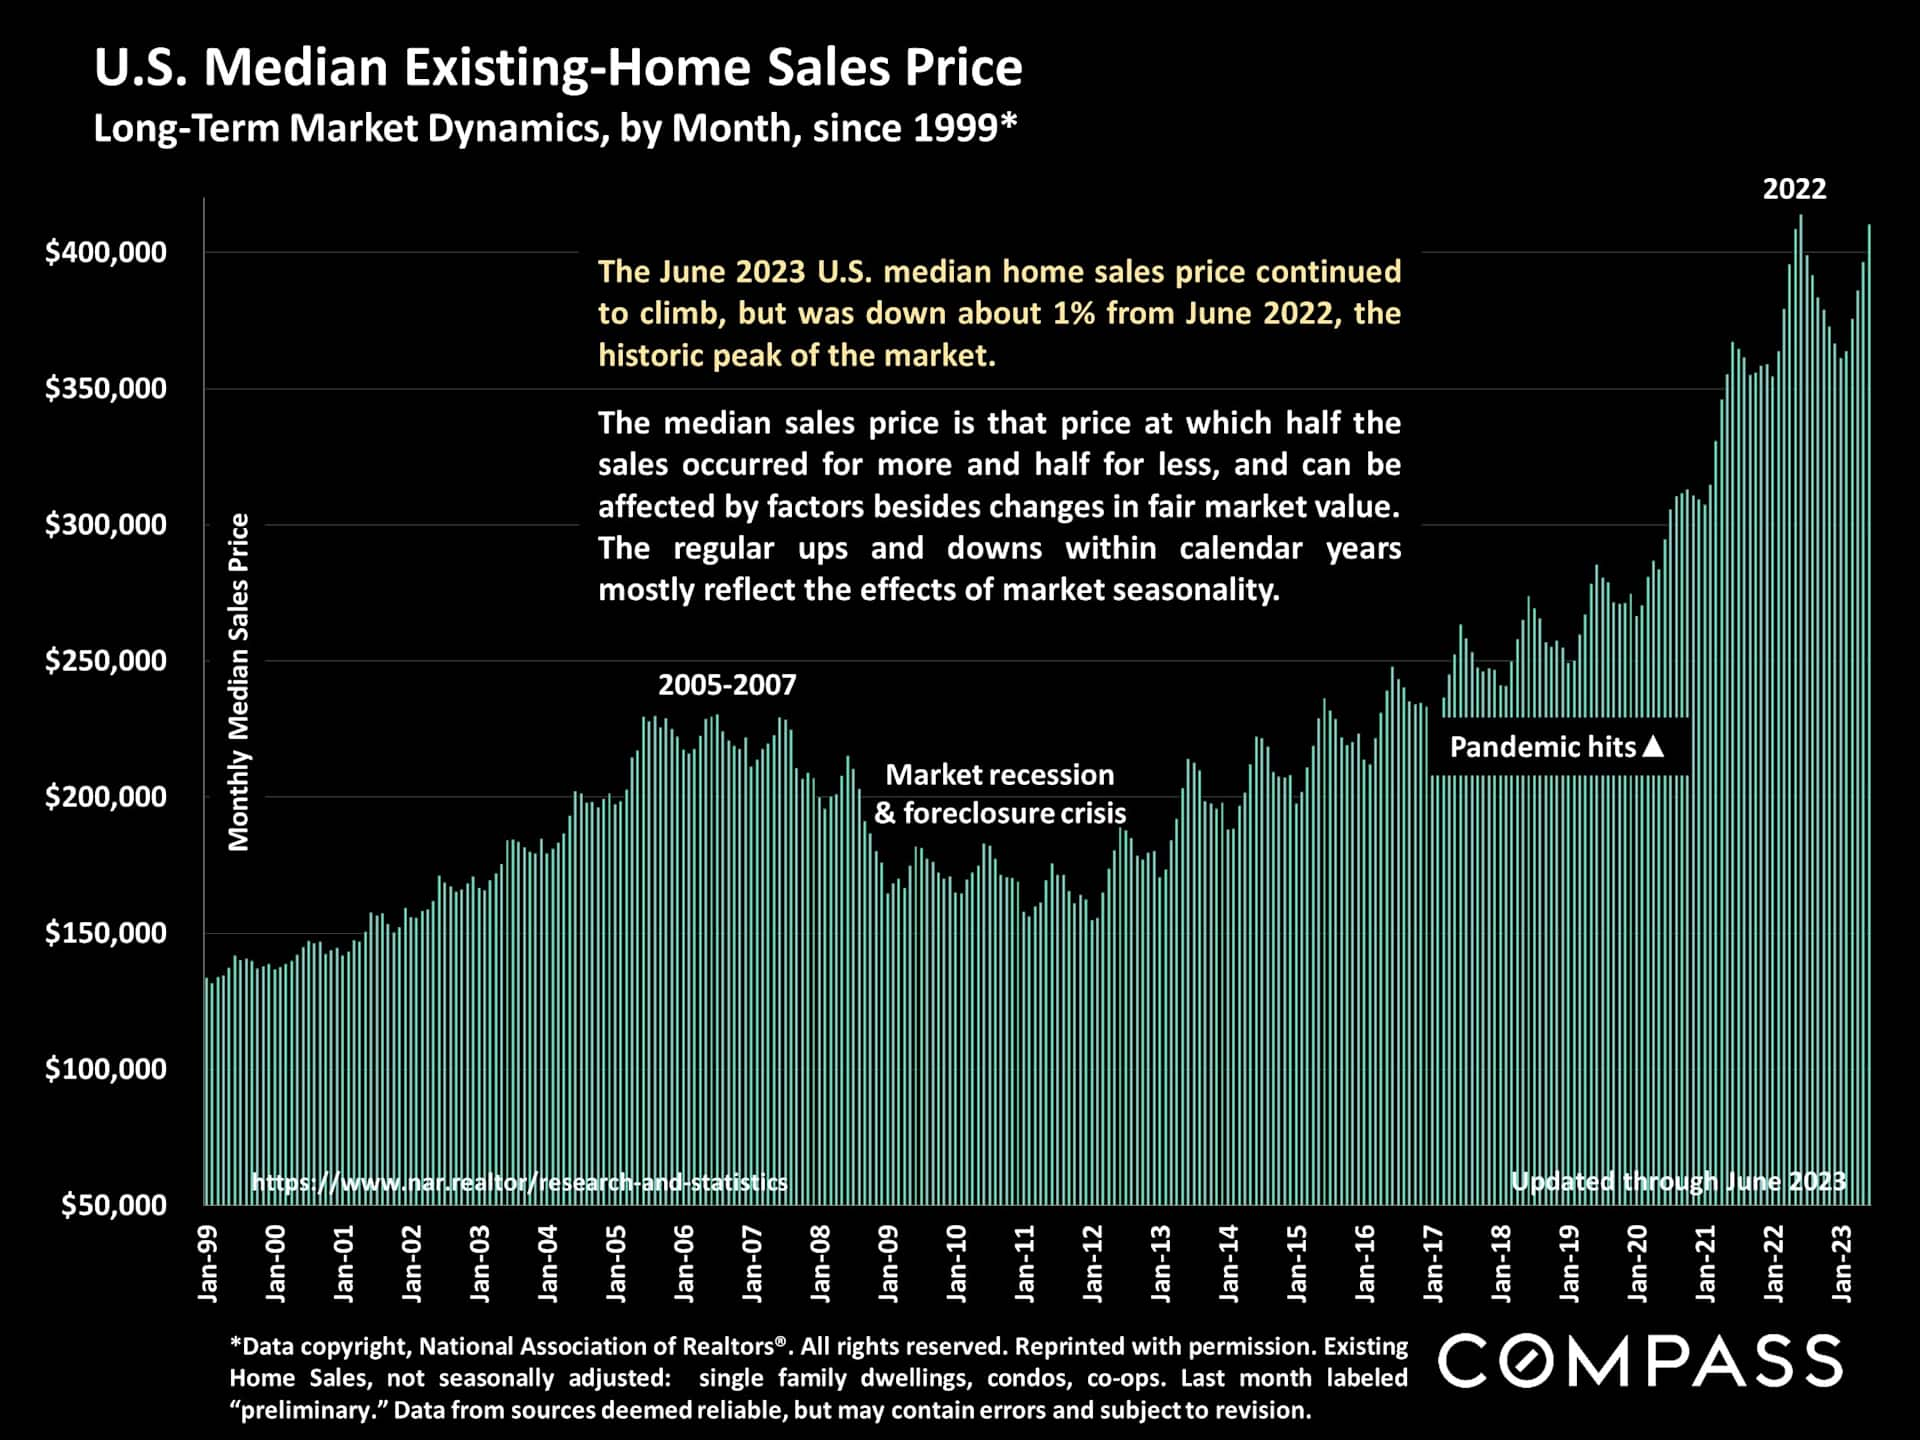
Regional trends in home prices generally follow a similar trajectory over the long term, although the extent of change may vary within specific periods due to local conditions.
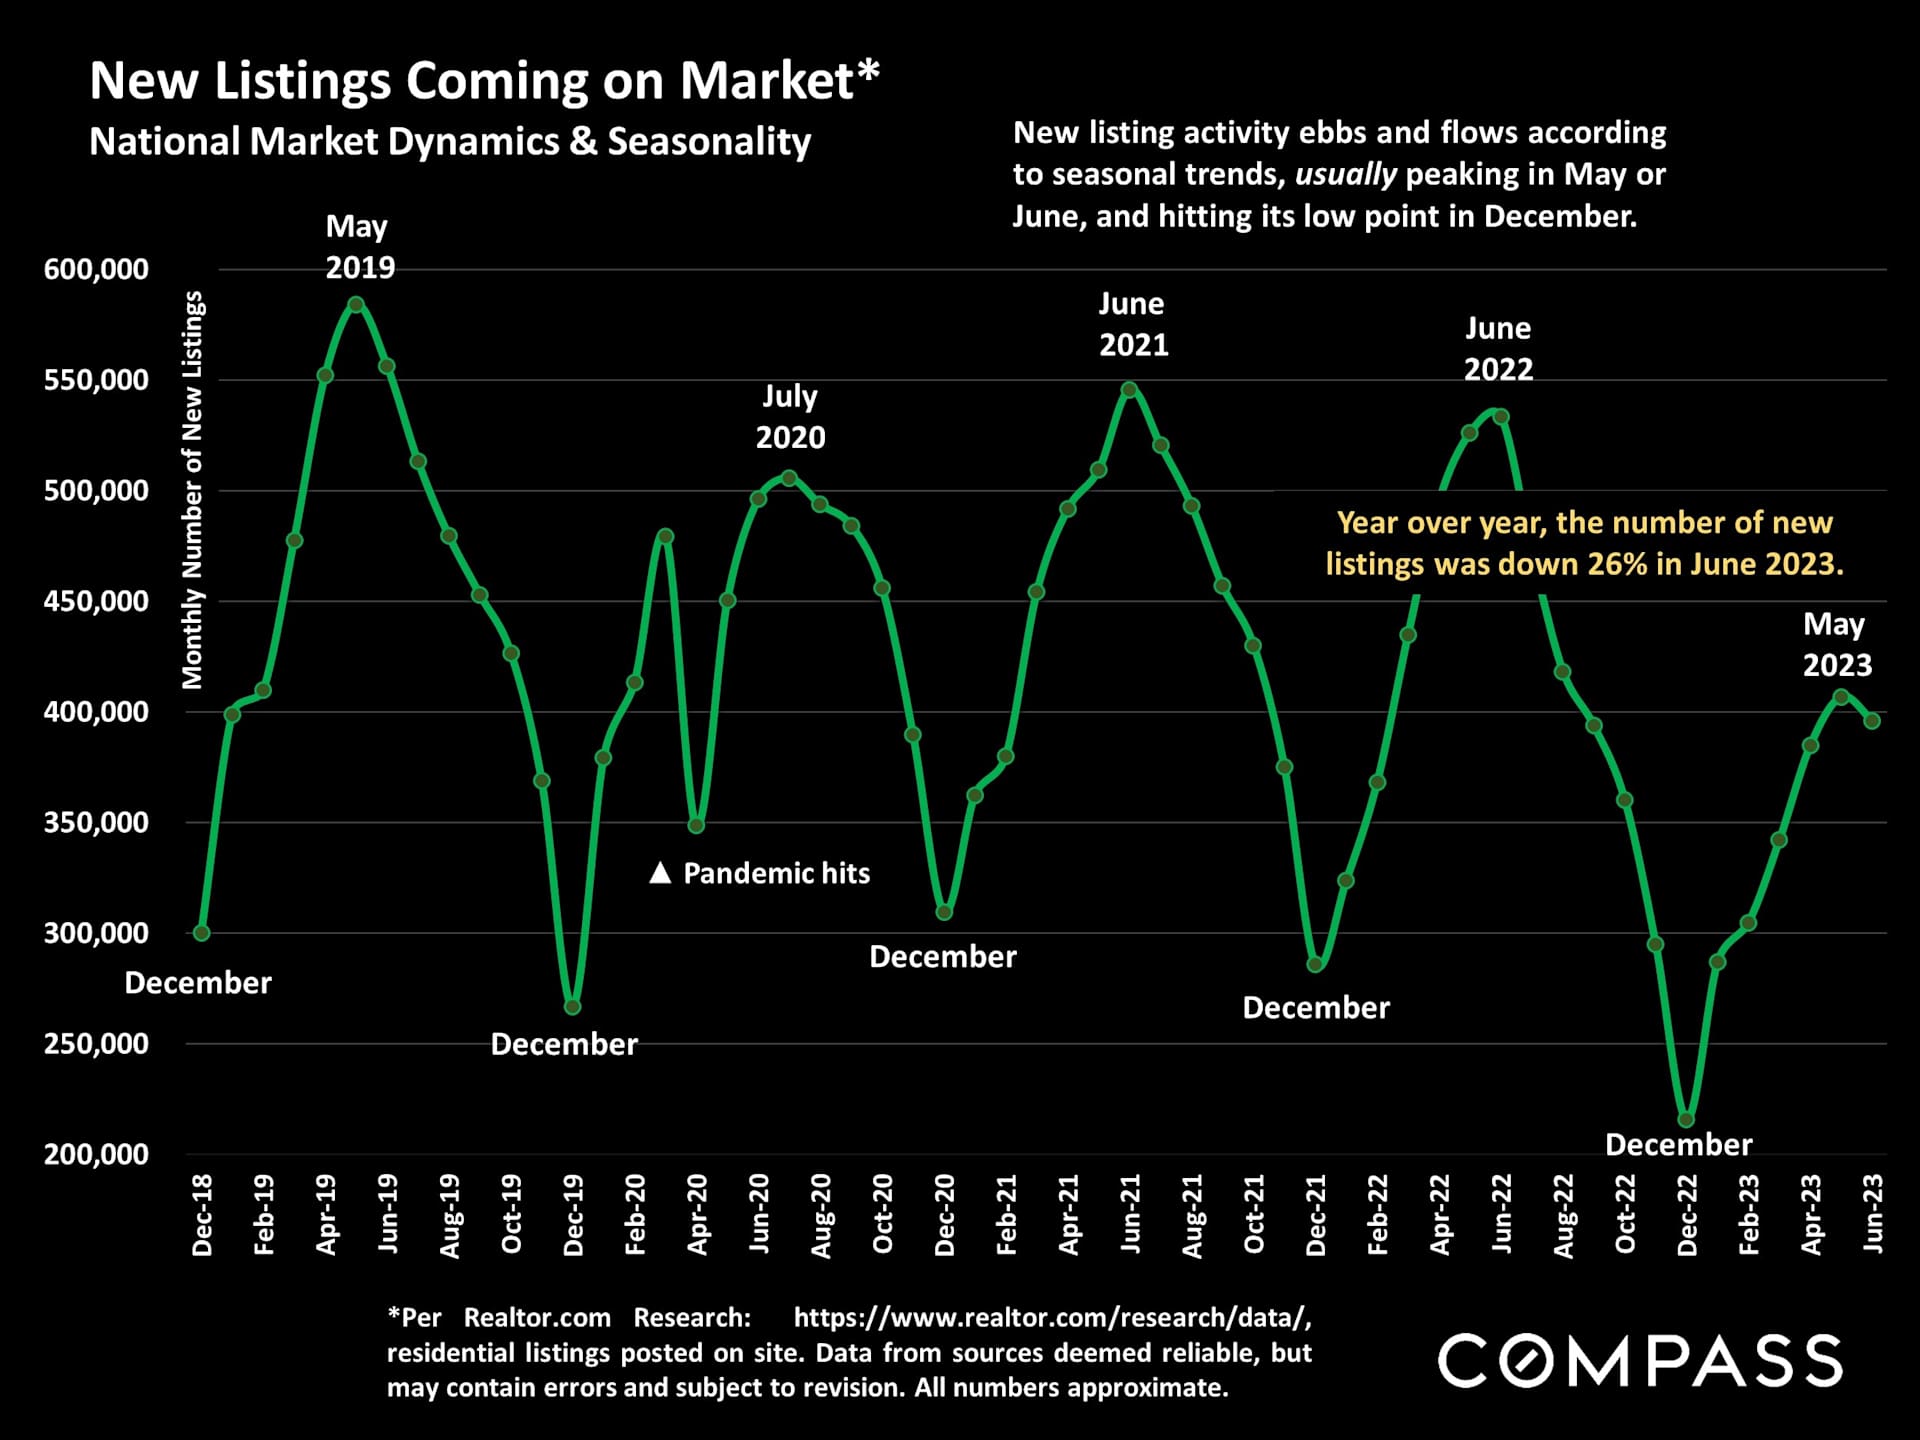
In the last year, there has been a significant and continuous reduction in the number of new properties listed for sale. This decline has had significant effects on the dynamics of the market and has contributed to pushing home prices higher in 2023.
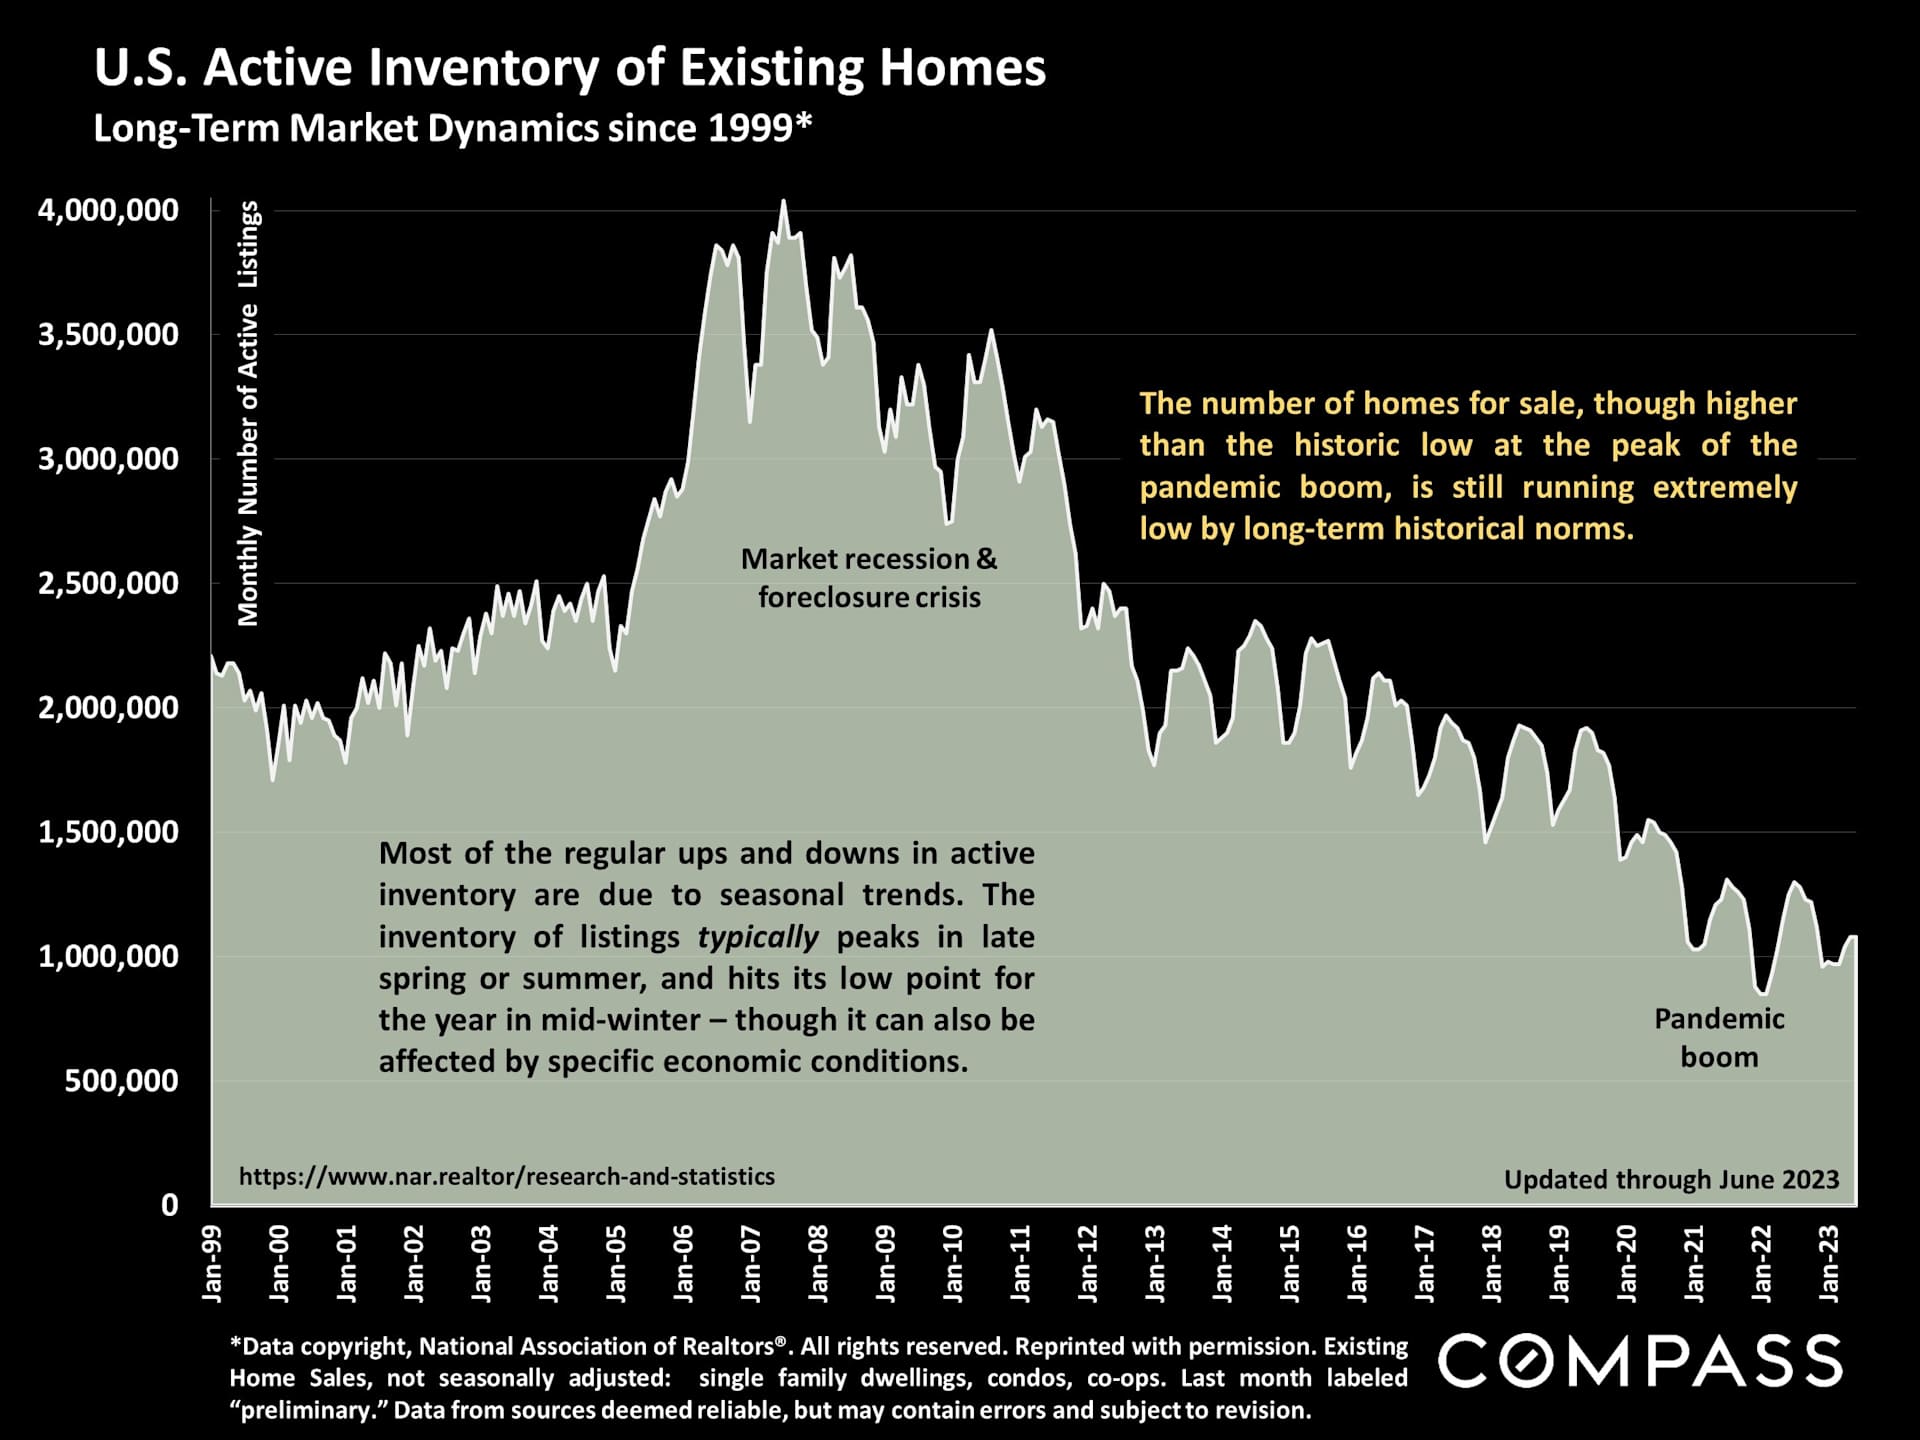
The inventory of homes available for sale remains very low, clearly insufficient to meet the demand. This shortage is influenced by both general economic factors and seasonal fluctuations.
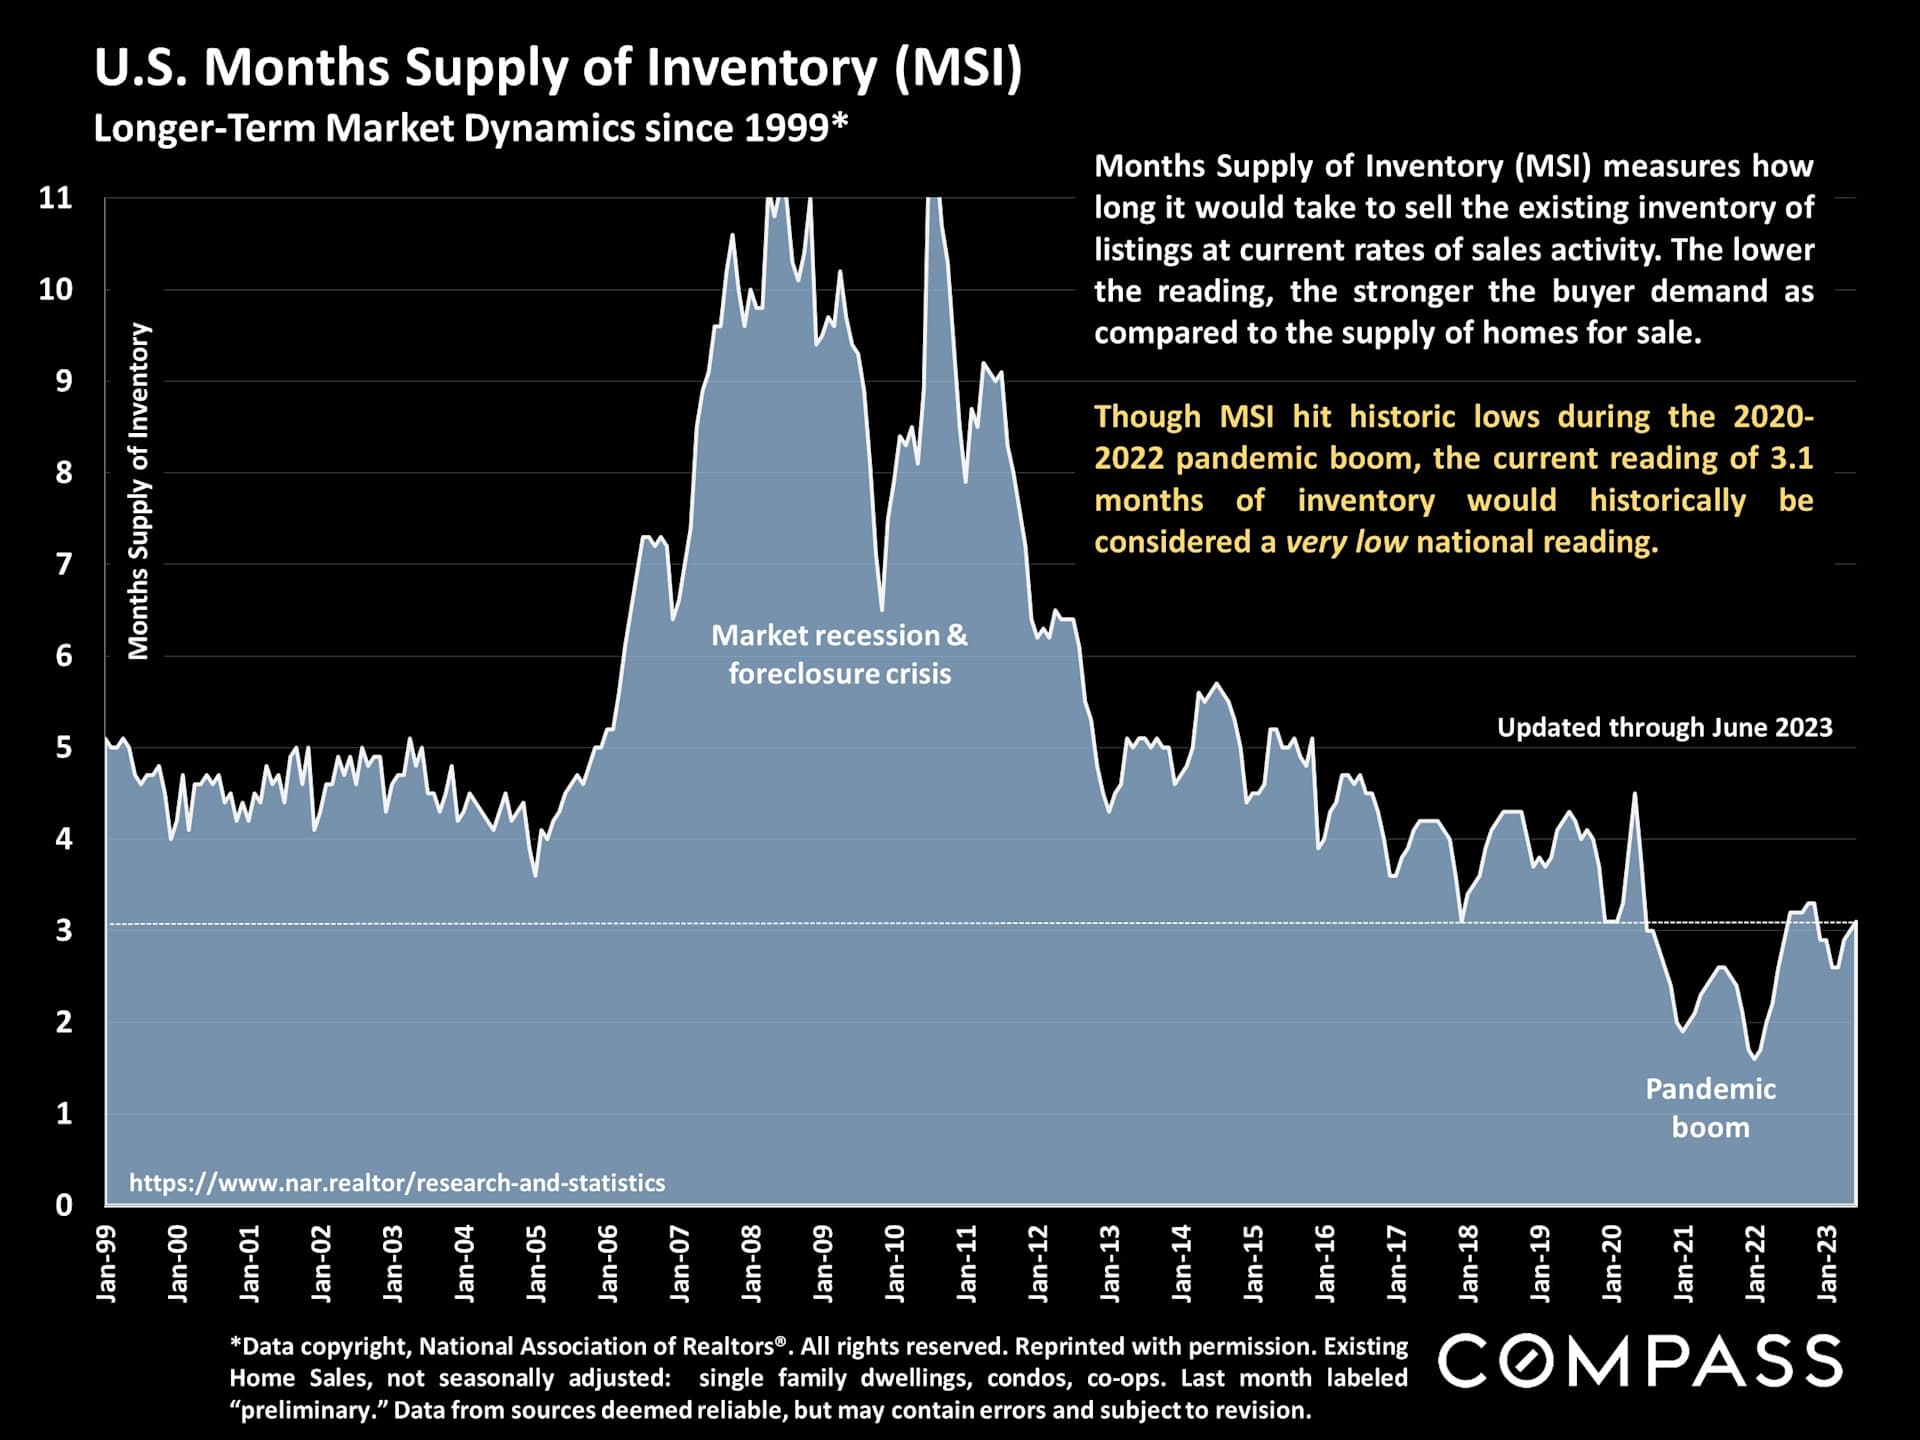
The "months-supply-of-inventory" metric measures the ratio of available listings to buyer demand. When this value is lower, it indicates more competitive and heated markets.
Another perspective on supply and demand is the ratio of pending listings (properties in contract) to active listings. When this ratio is higher, it indicates more competitive market conditions.
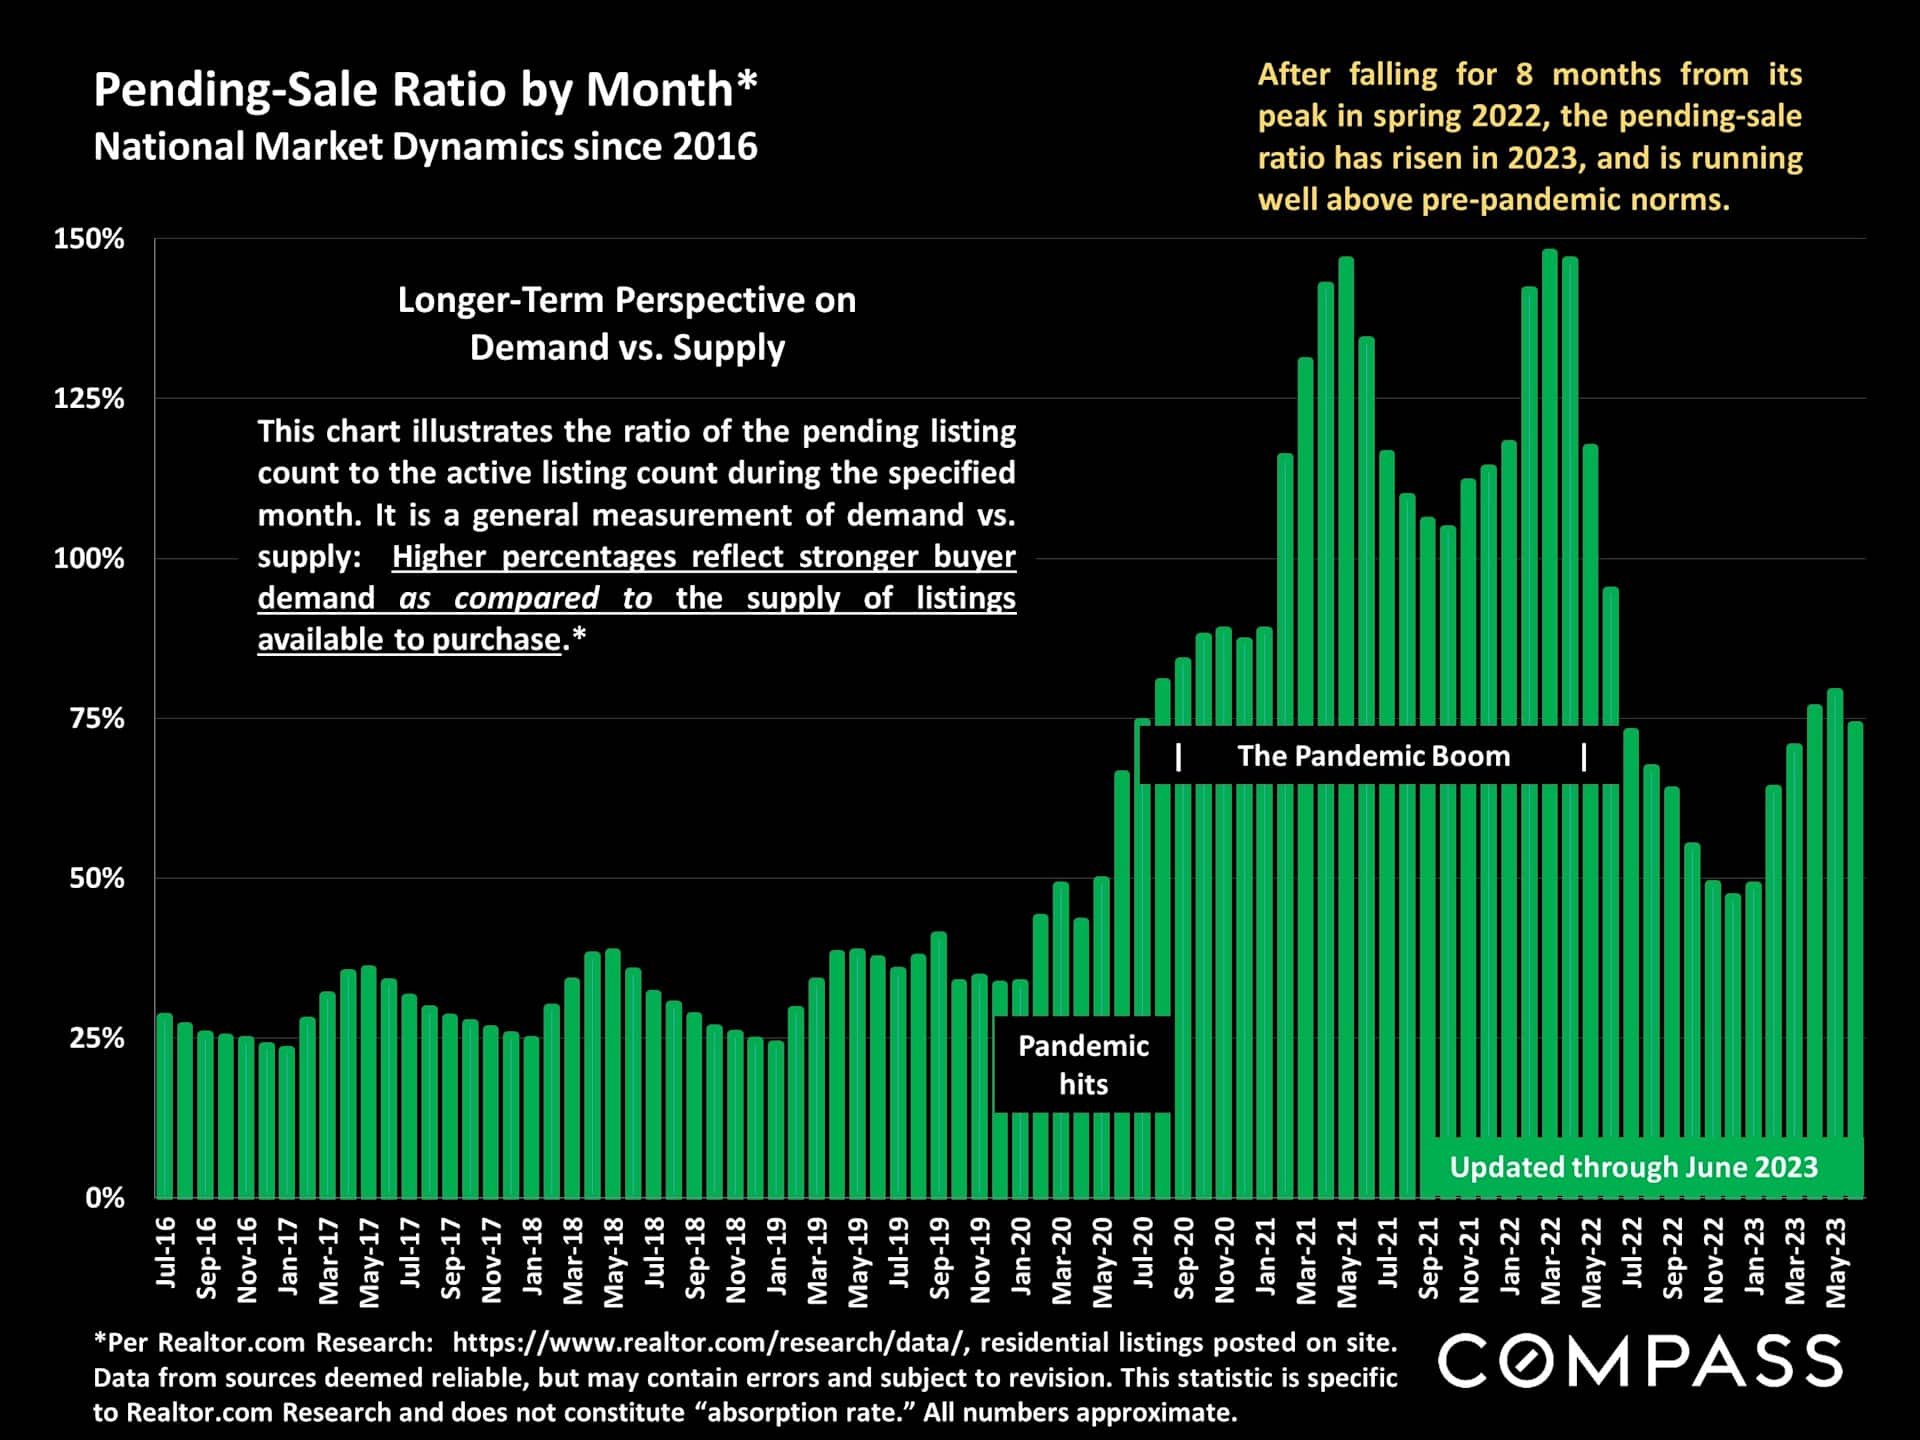
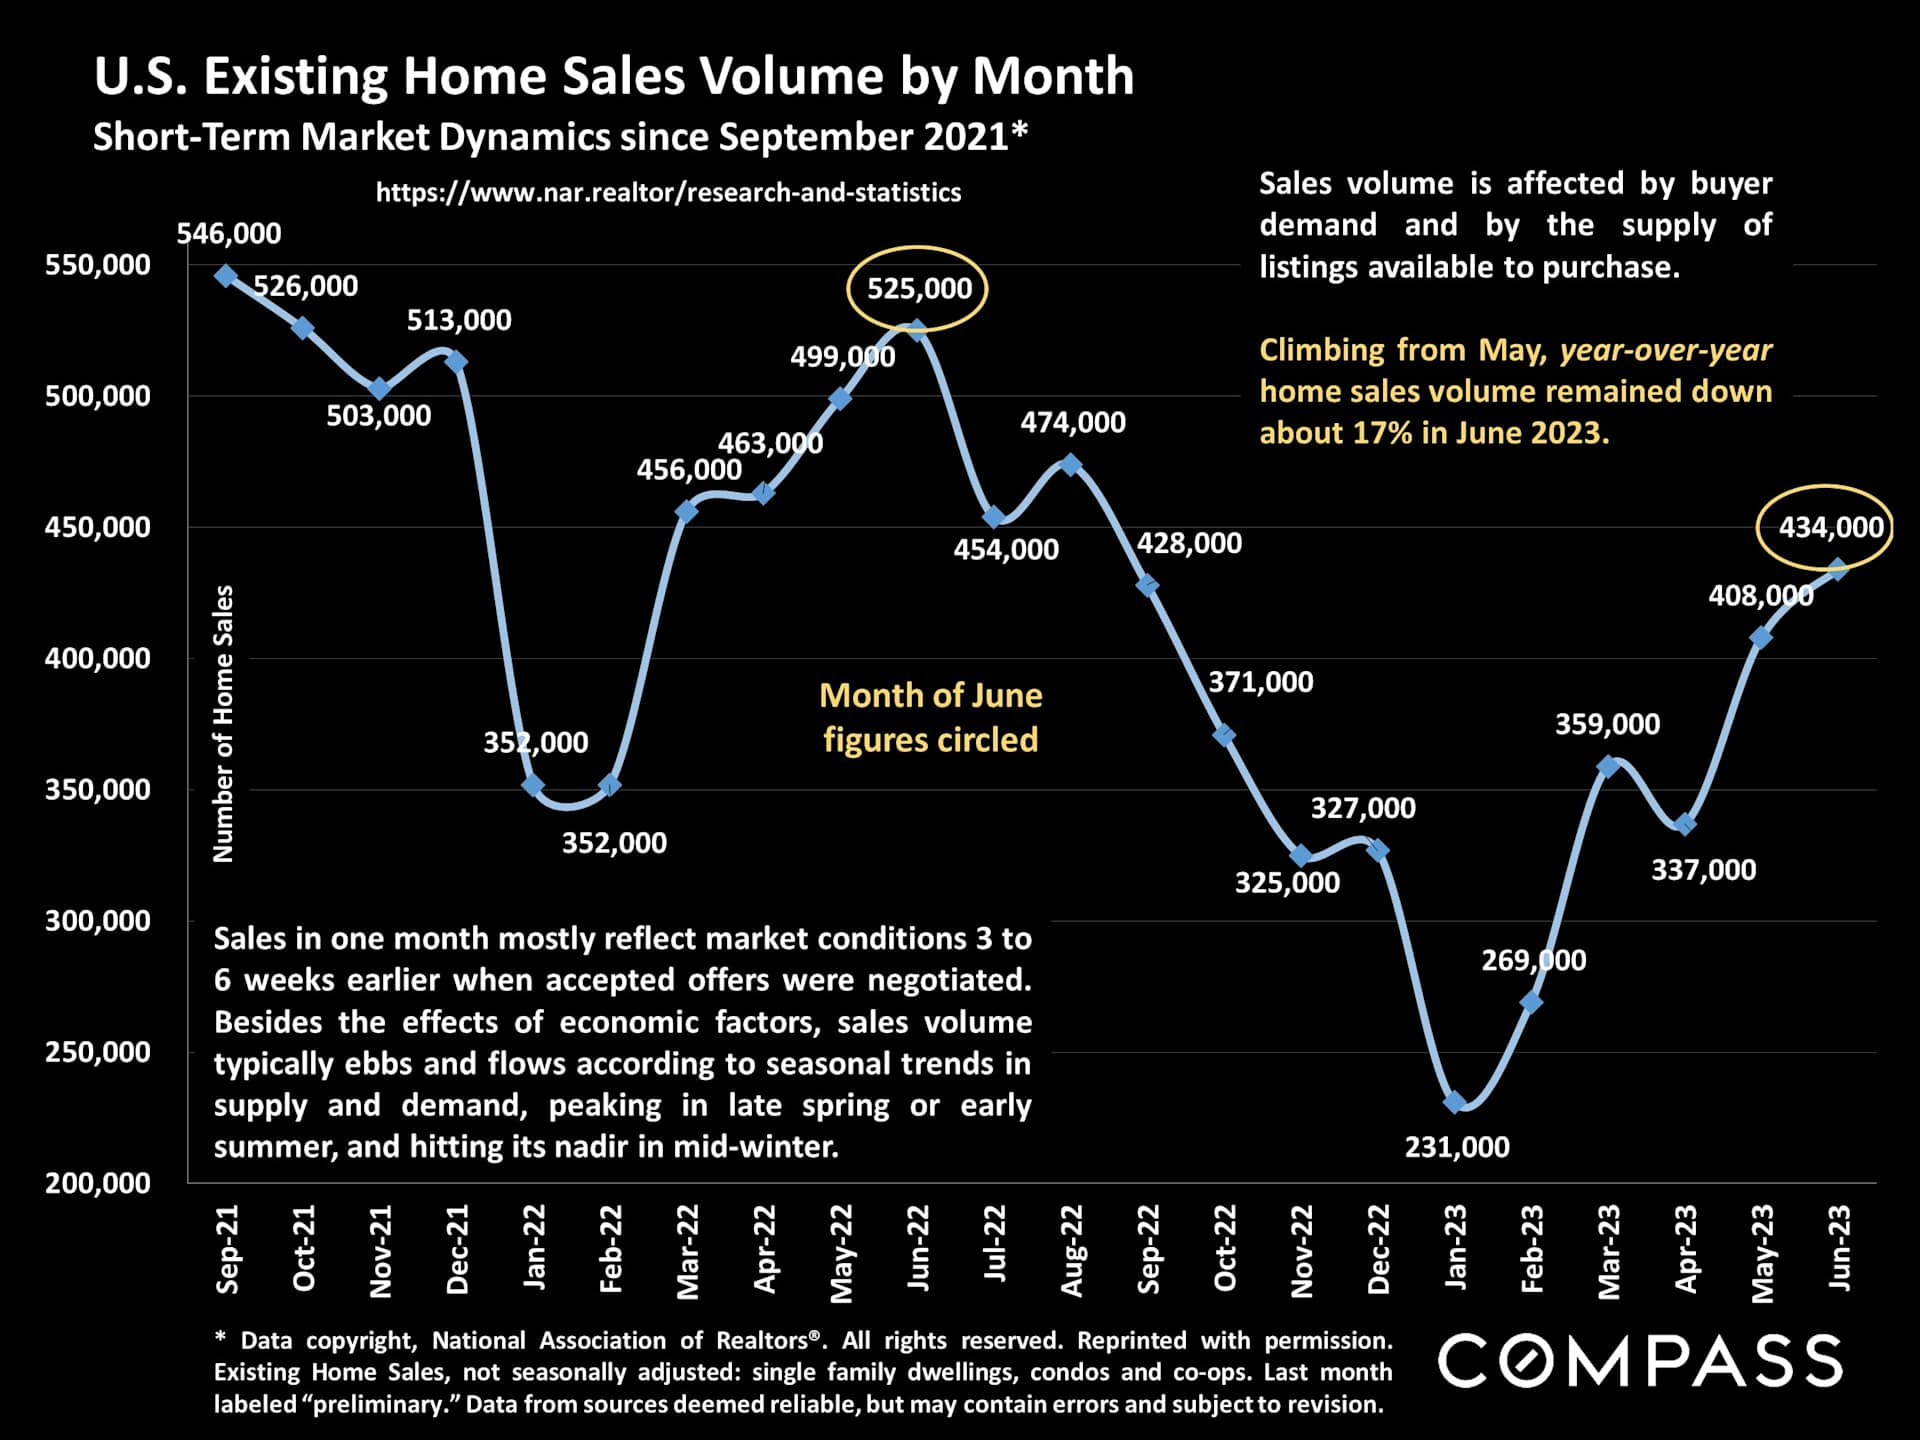
Home sales have recovered from the lowest point in late 2022, but they are still below historical norms, primarily because of the decrease in new property listings.
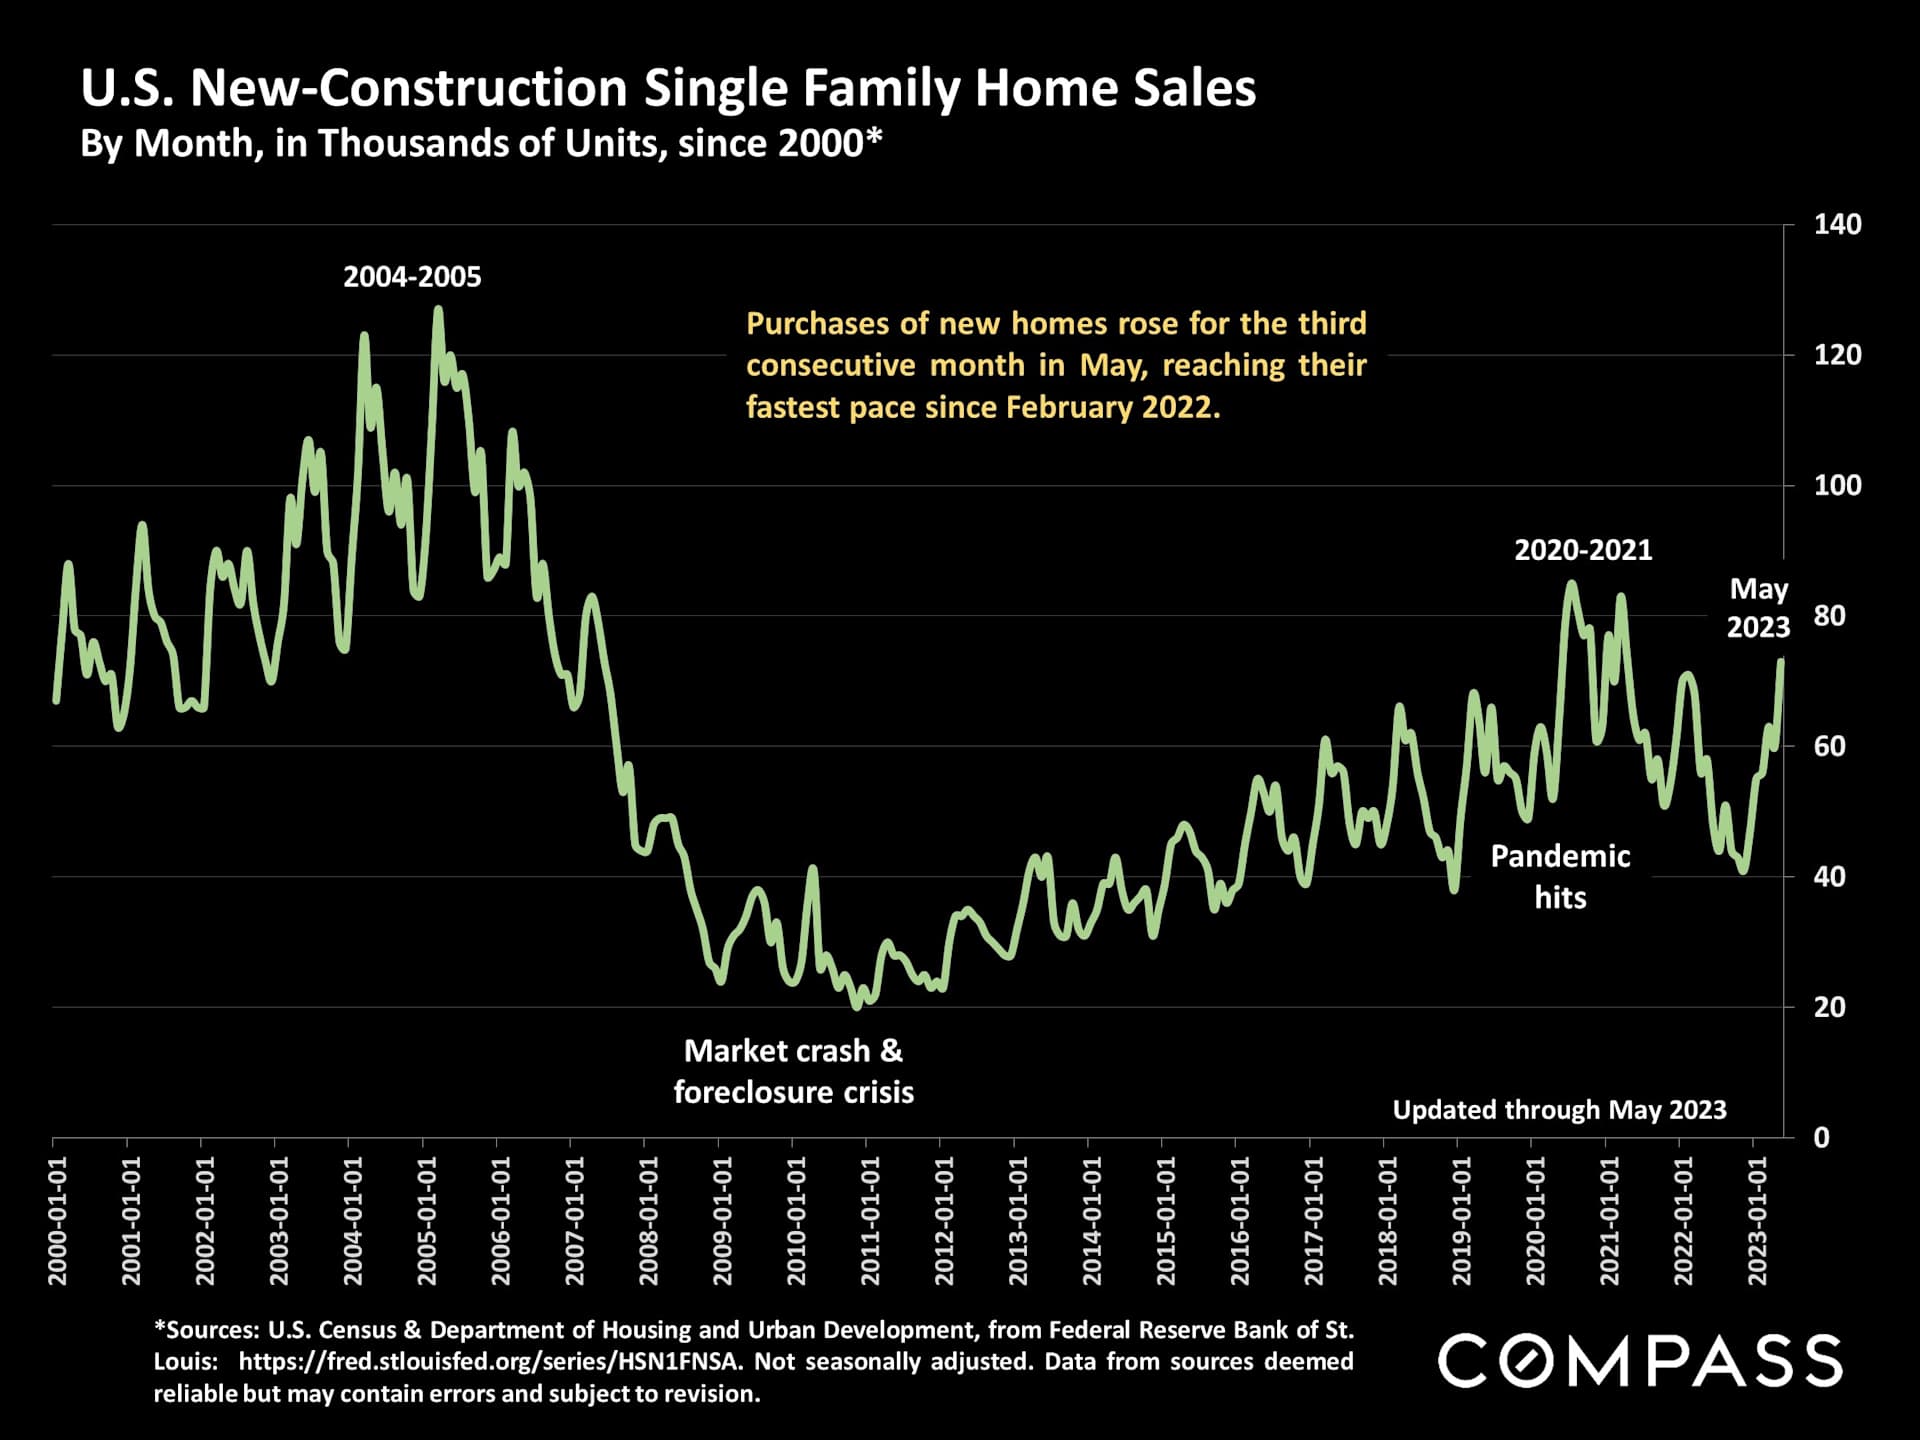
In the last year, numerous homeowners refrained from listing their properties, but at the same time, developers have been rapidly increasing the construction of new homes and sales.
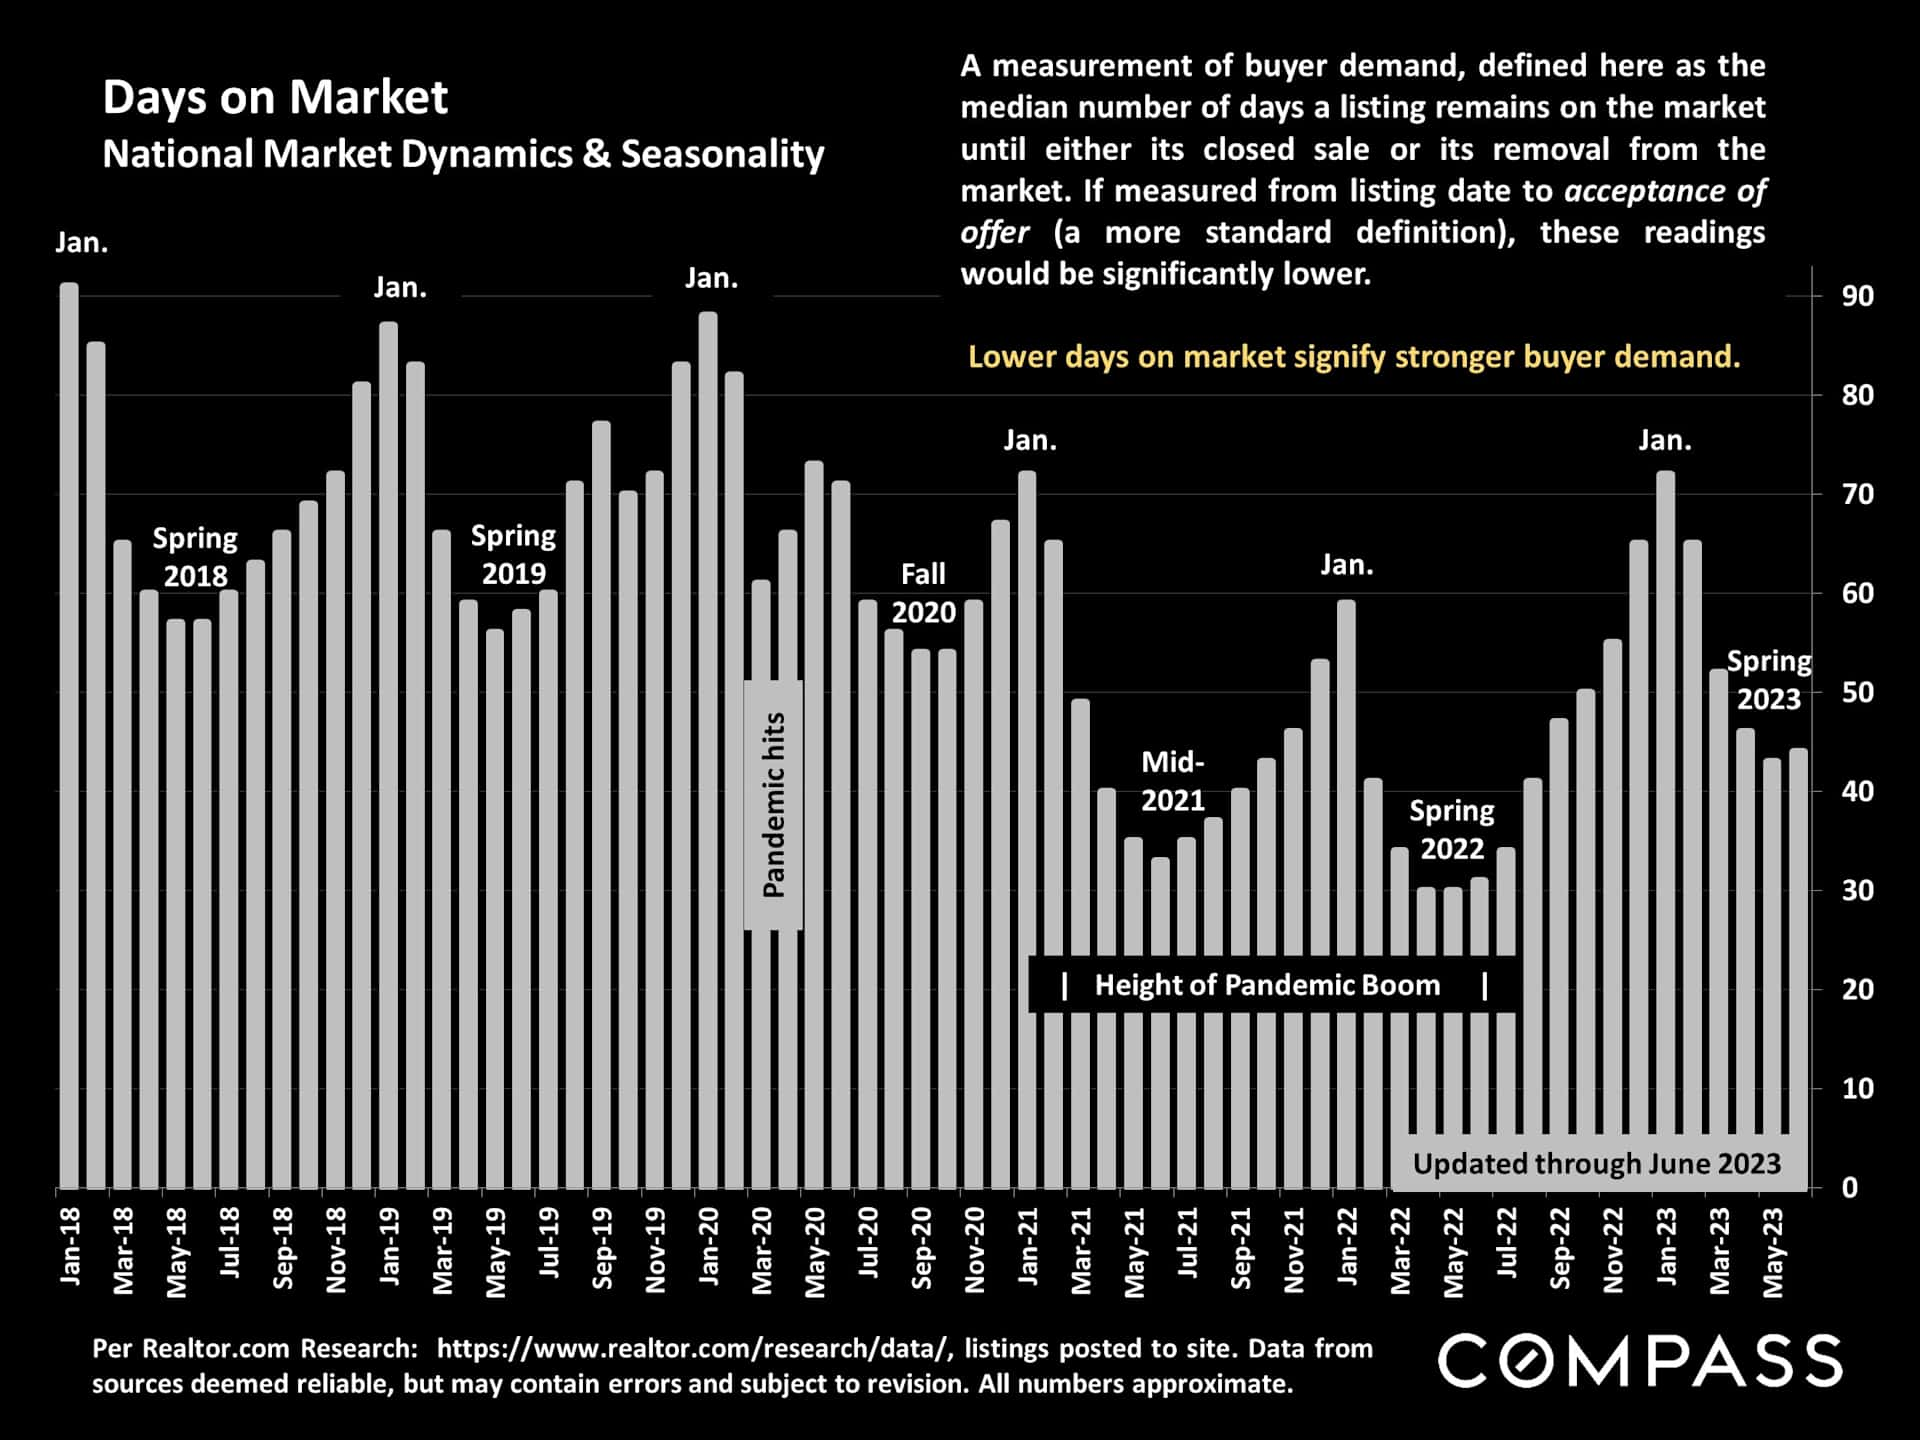
At present, the number of days a property stays on the market is higher compared to the period of the pandemic boom but remains lower than historical averages. Like many other indicators, it fluctuates with the changing seasons.
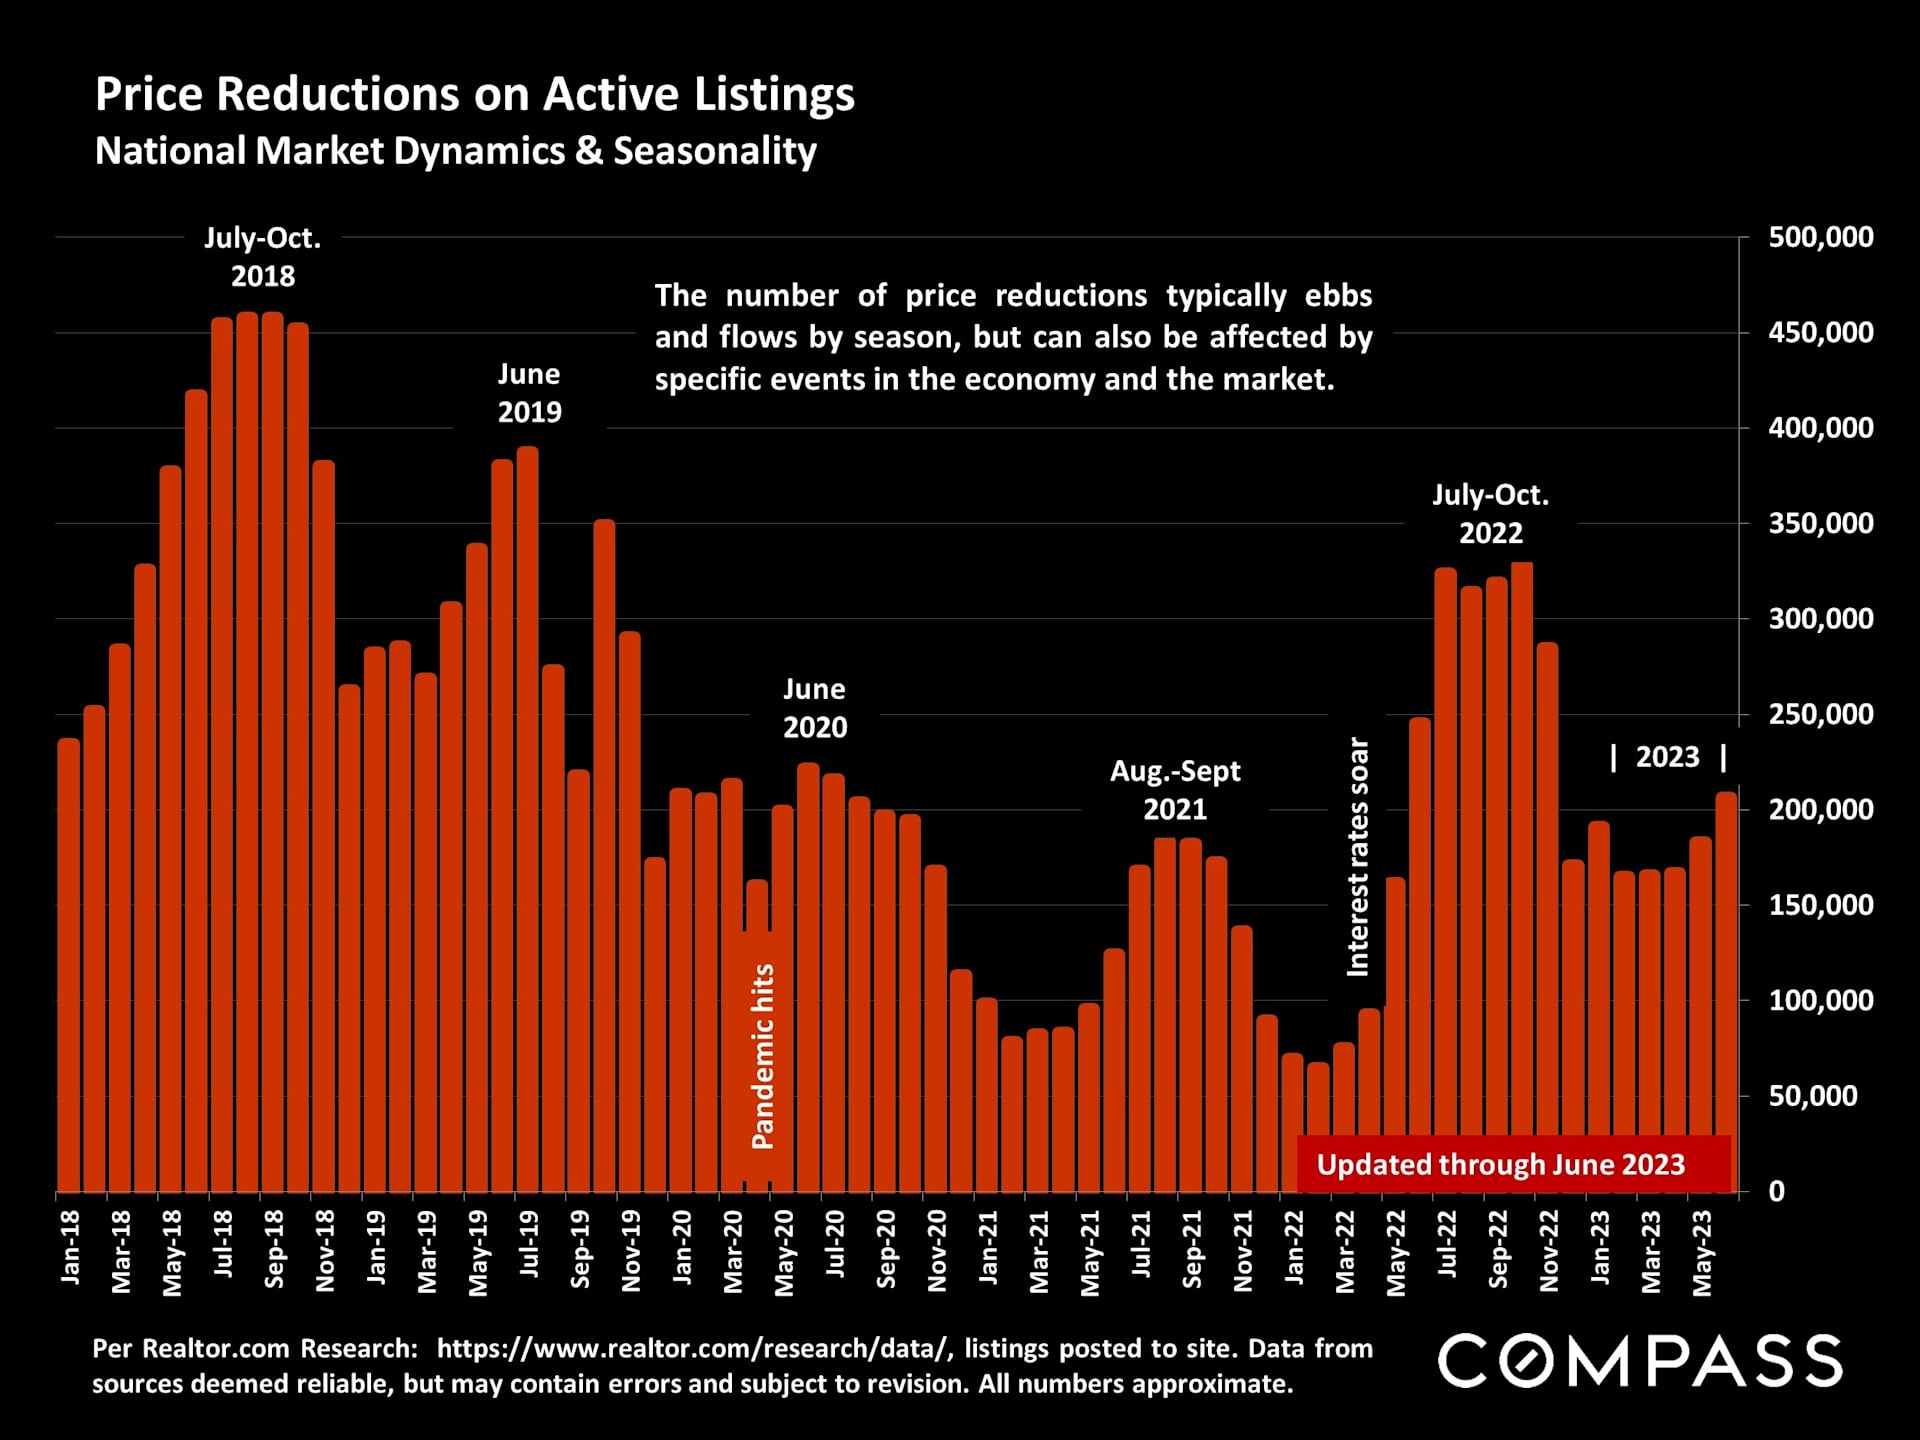
Price reductions fluctuate in response to abrupt shifts in economic conditions and, more consistently, due to seasonal patterns in supply and demand.
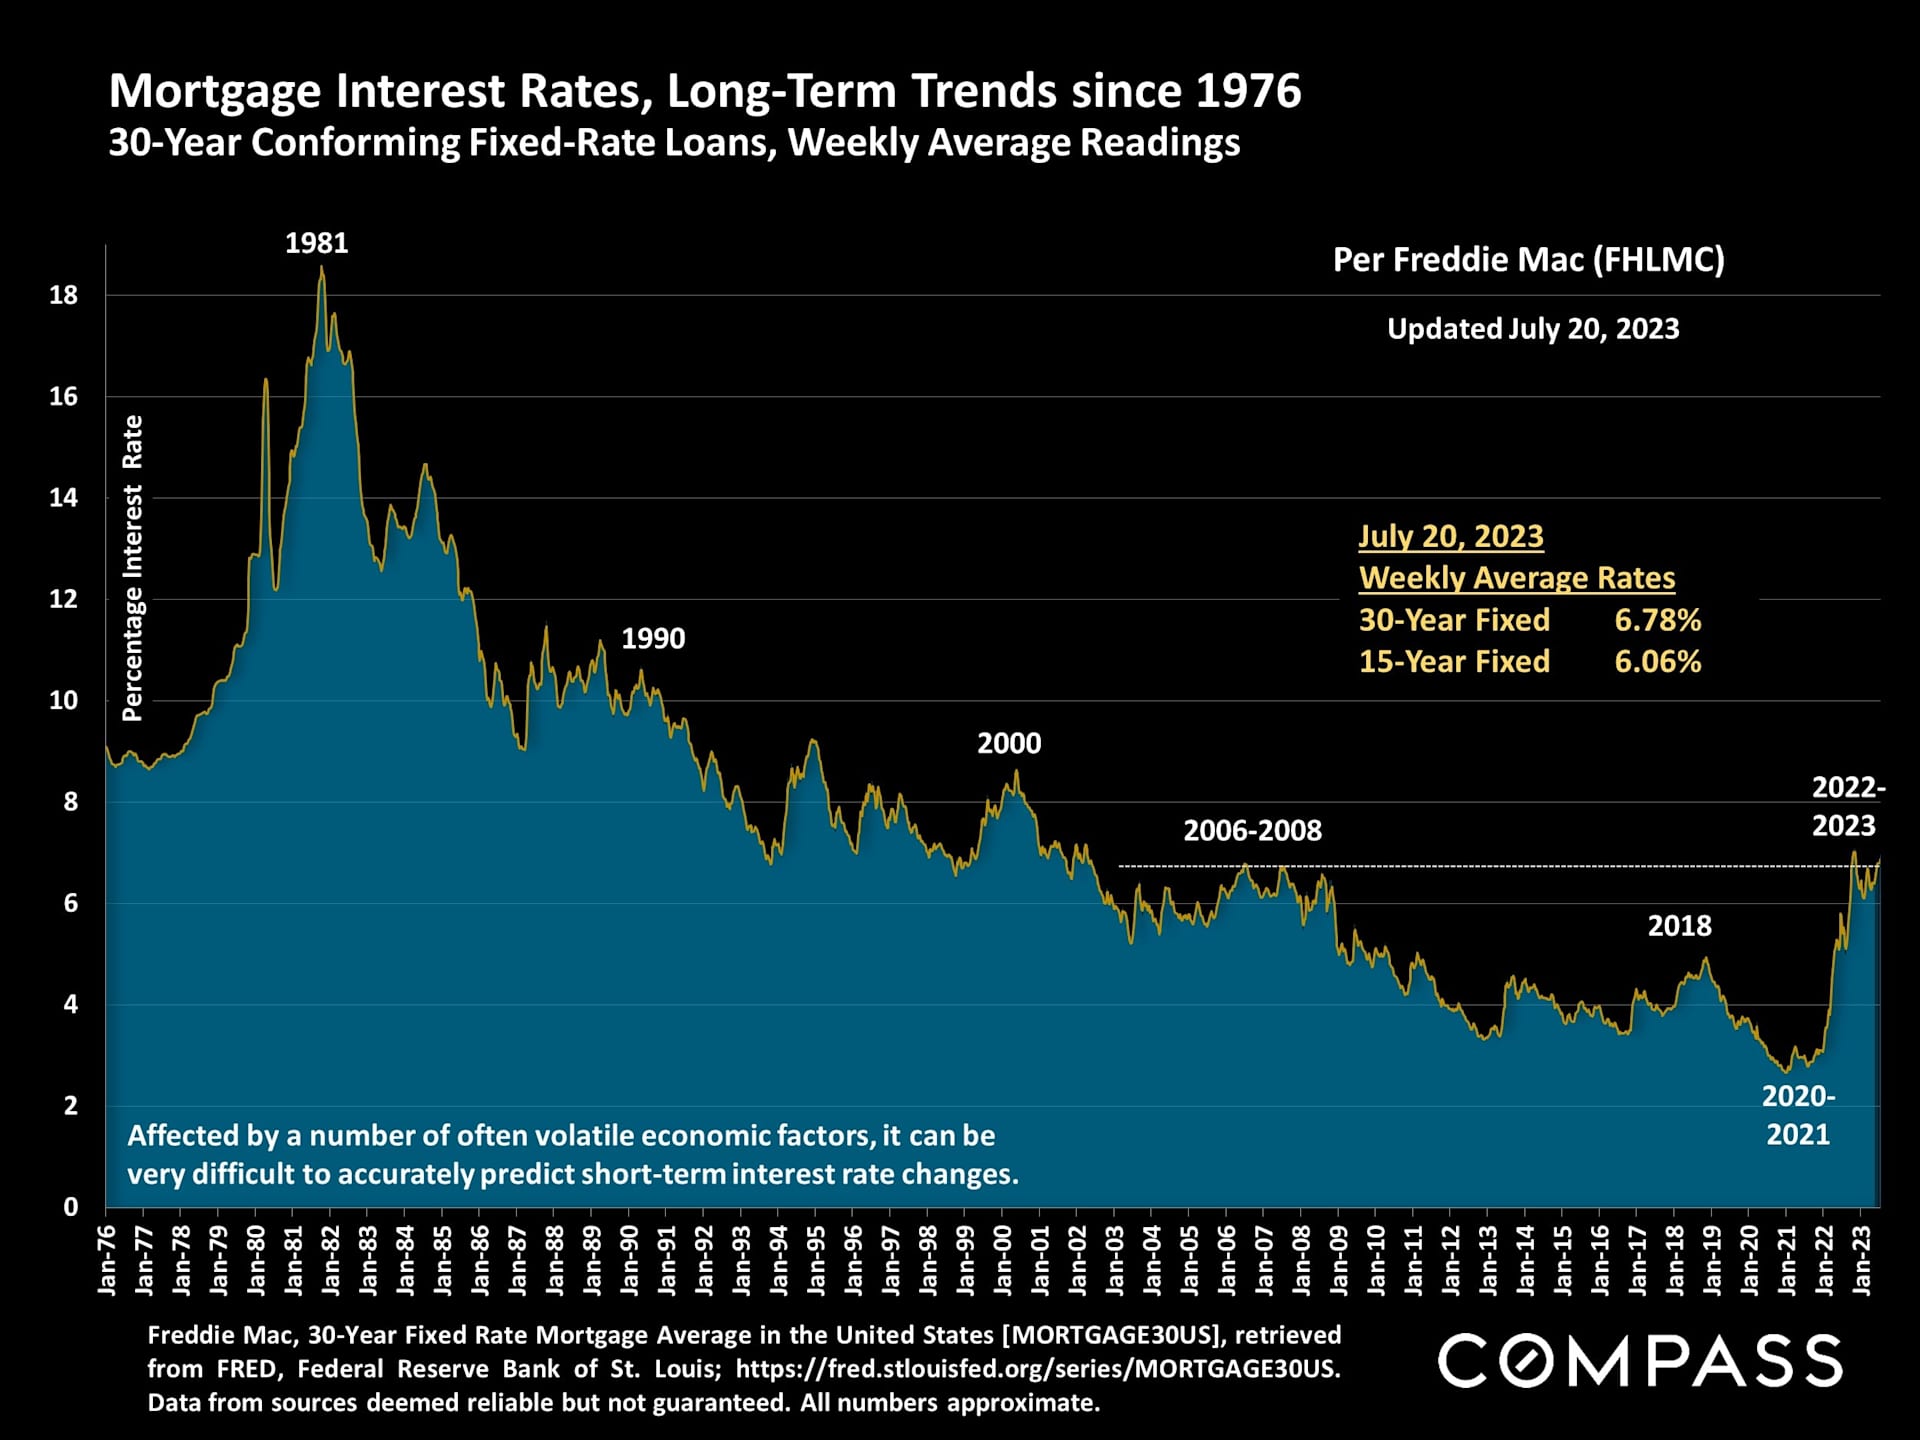
A long-term representation of interest rates shows that in the past year, after experiencing a significant increase in early 2022, 30-year fixed rates have mostly fallen within the range of 6% to 7%.
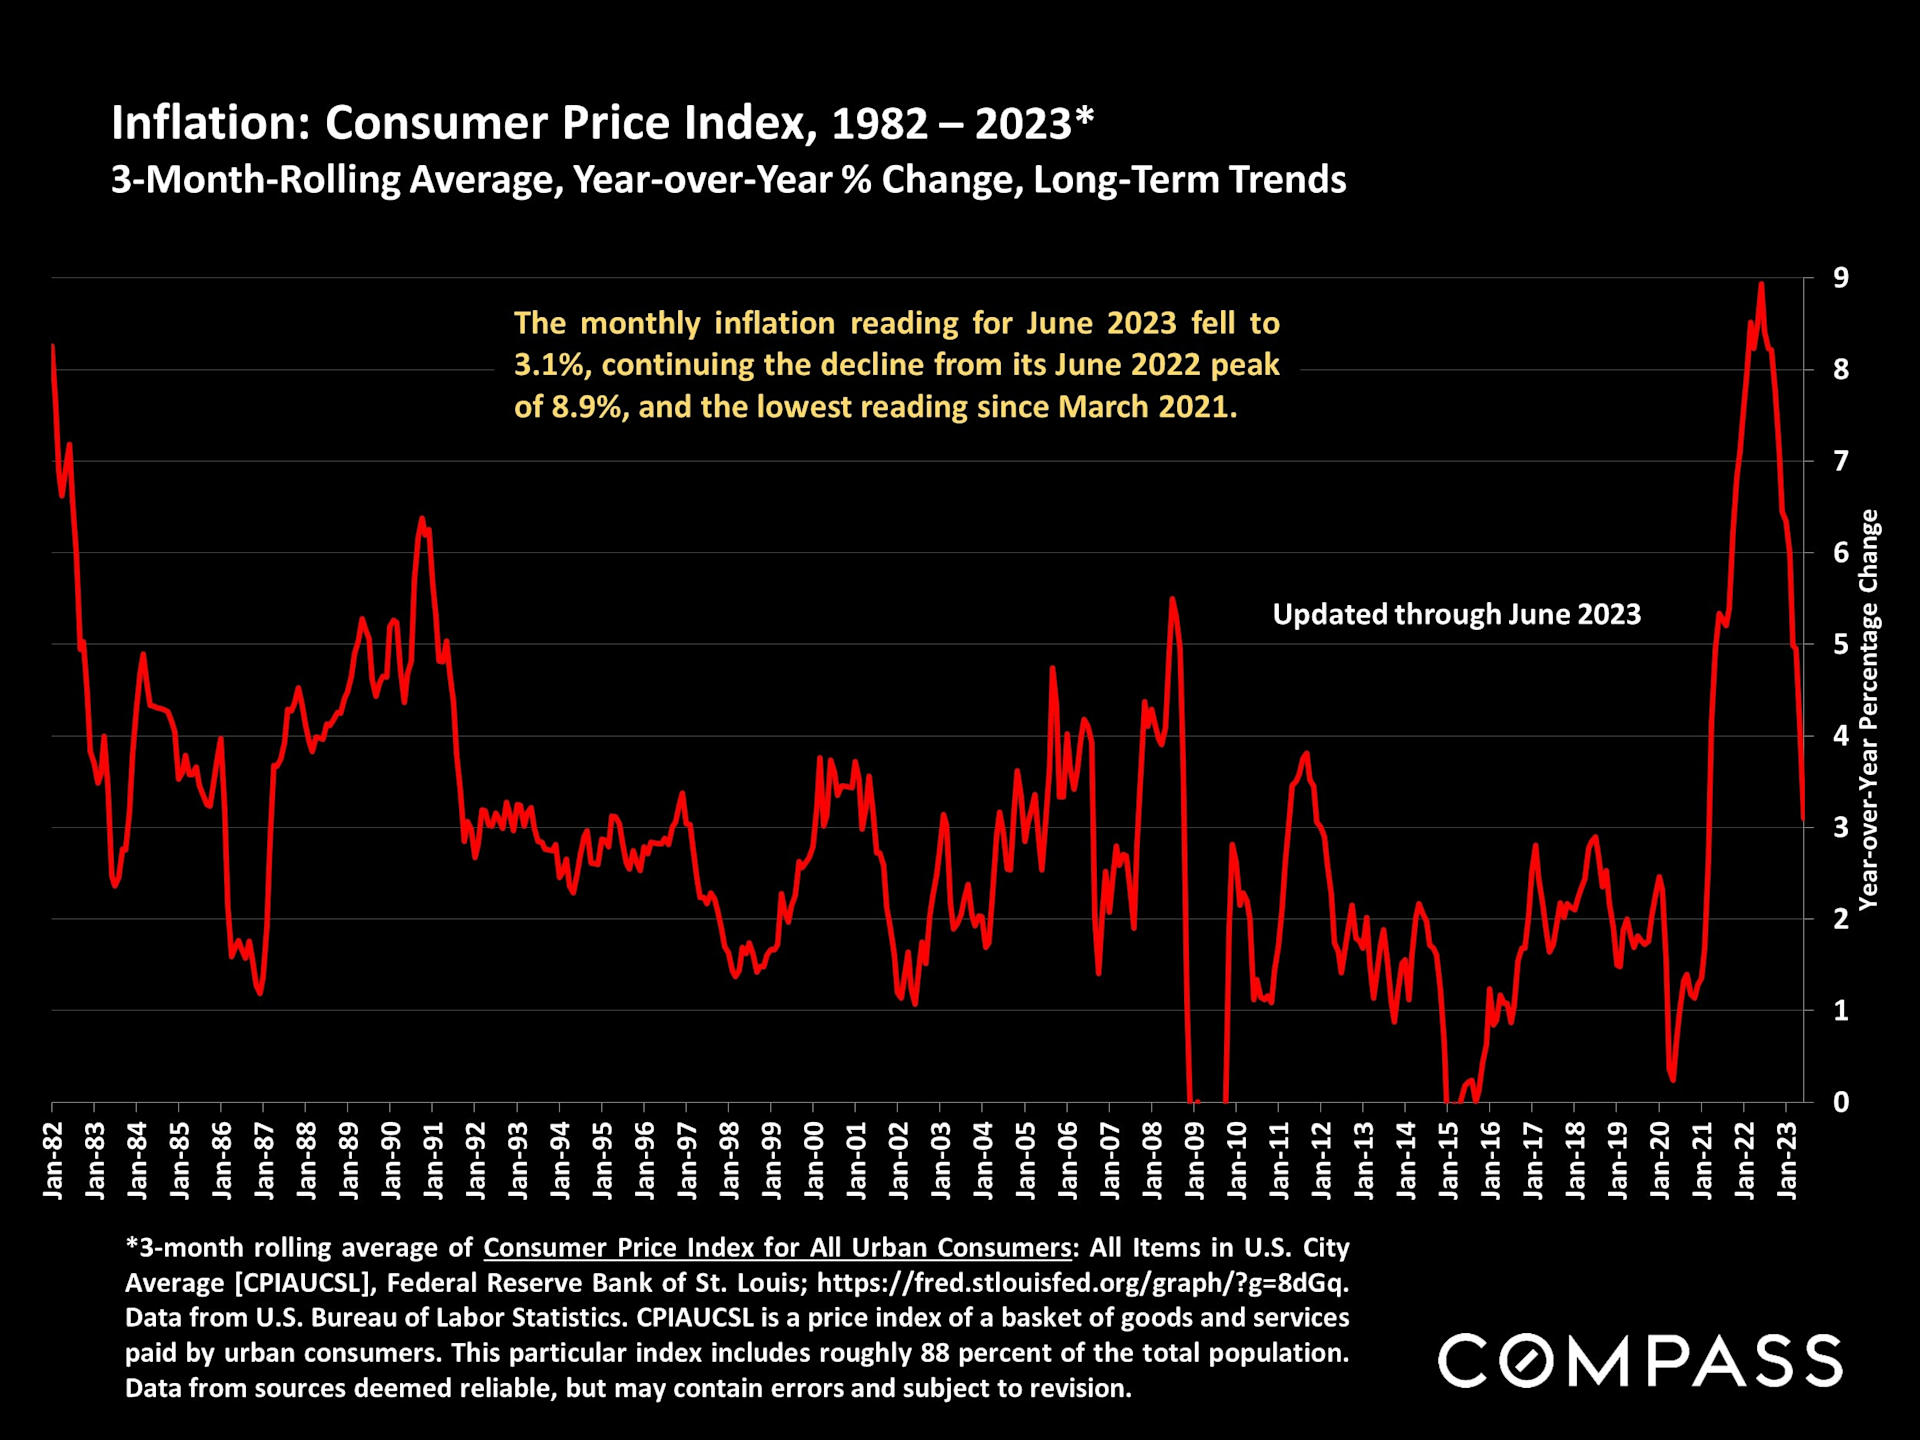
Over the past 18 months, inflation emerged as a crucial economic factor, reaching its highest level in 40 years in June 2022, but has since rapidly declined.
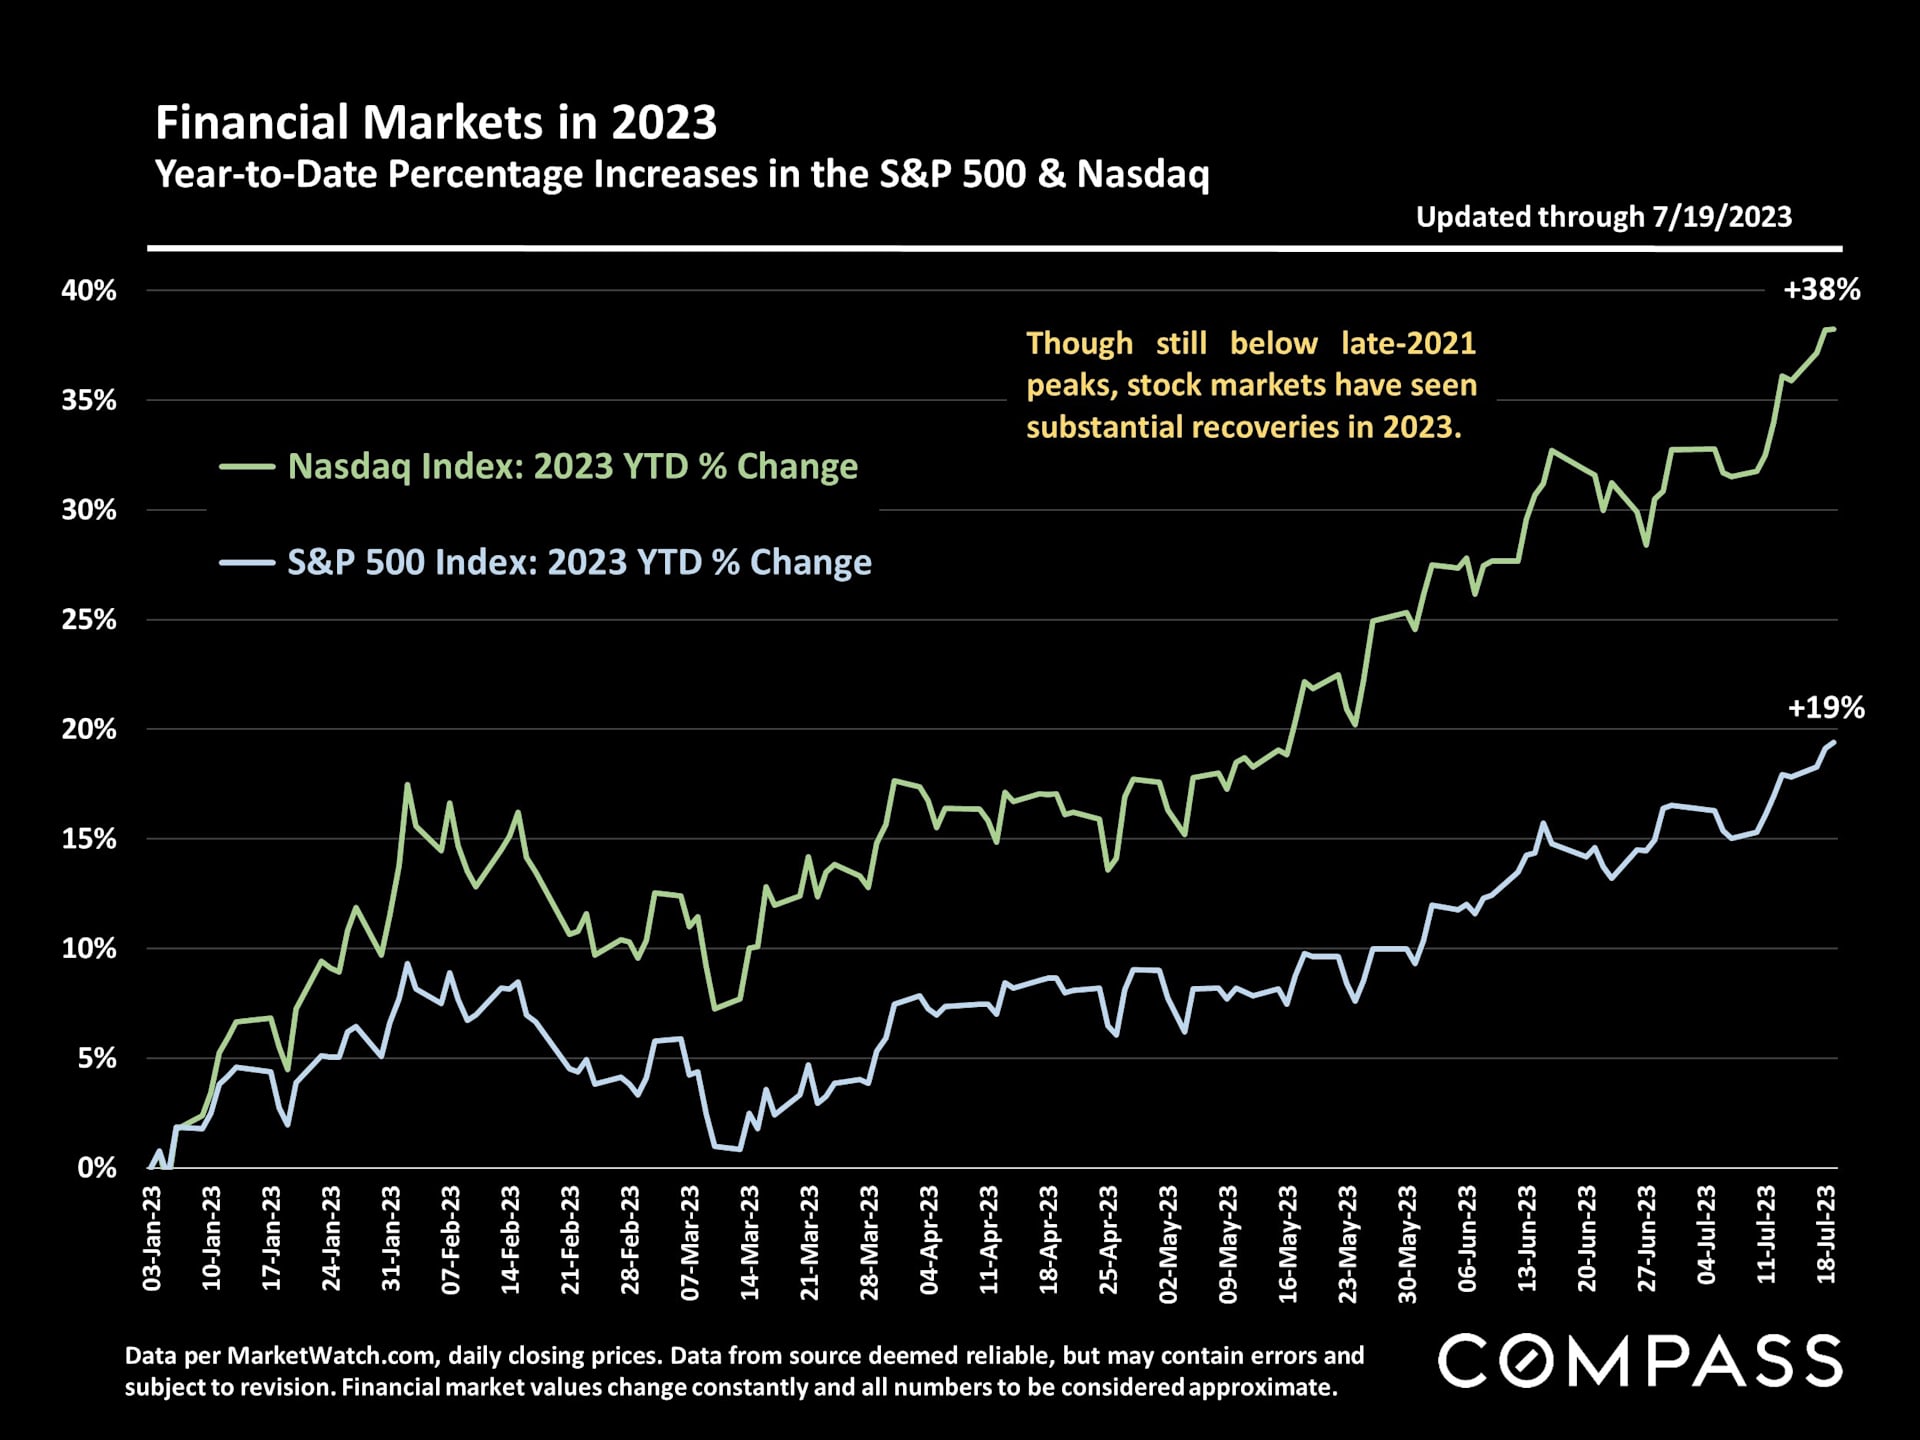
In 2023, financial markets have experienced a substantial surge, significantly influencing household wealth, which is a crucial factor in housing markets, particularly in the higher price segments.