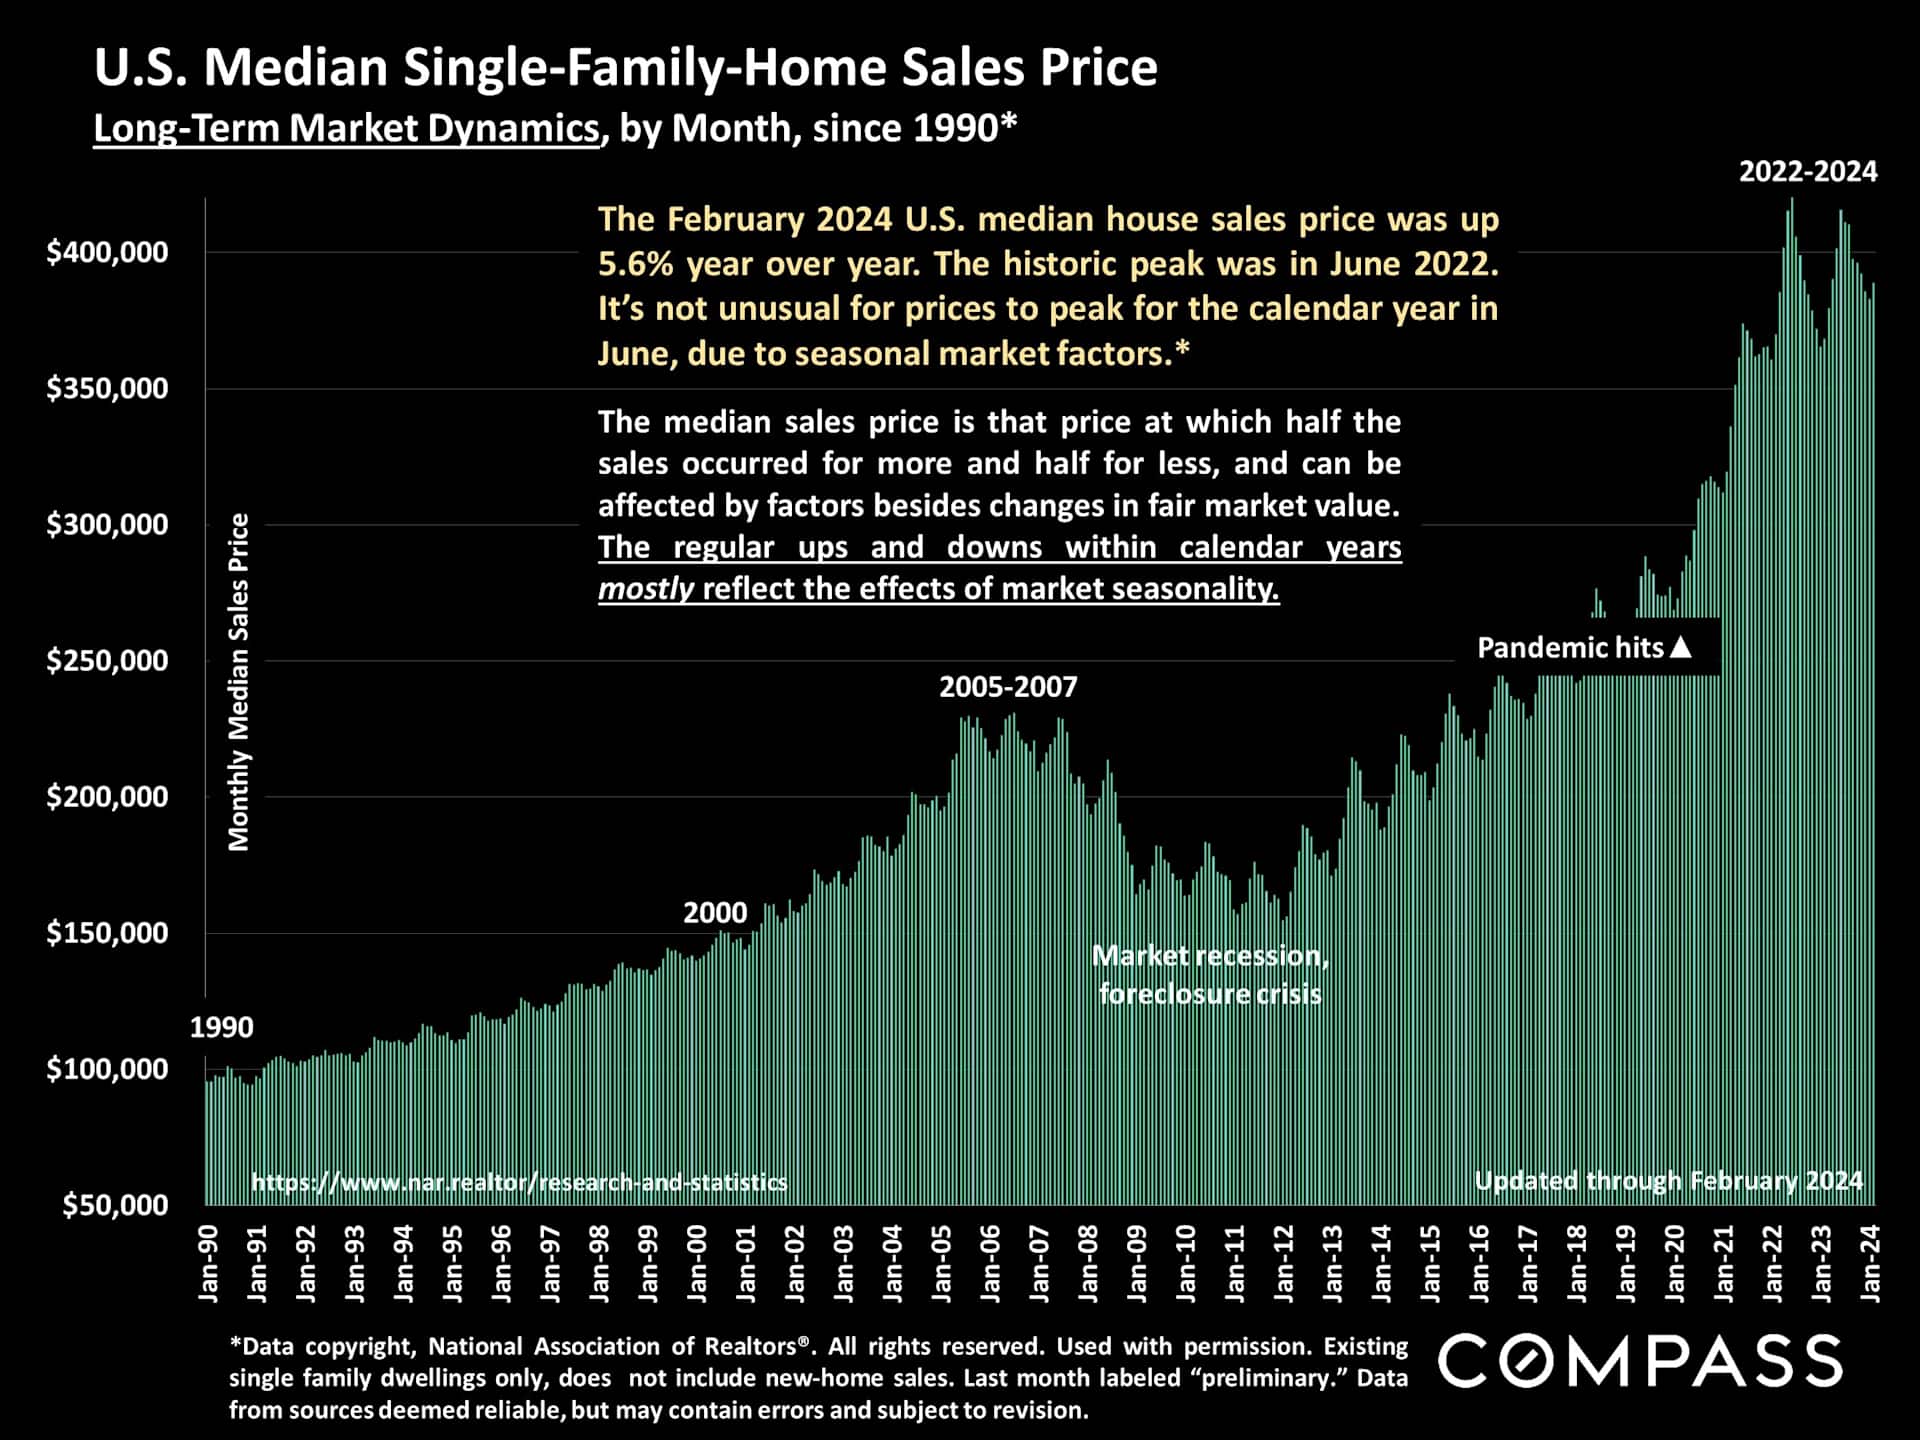
A long-term view of the national median house sales price since 1990. Due to seasonal supply and demand factors, median sales prices usually peak in spring.
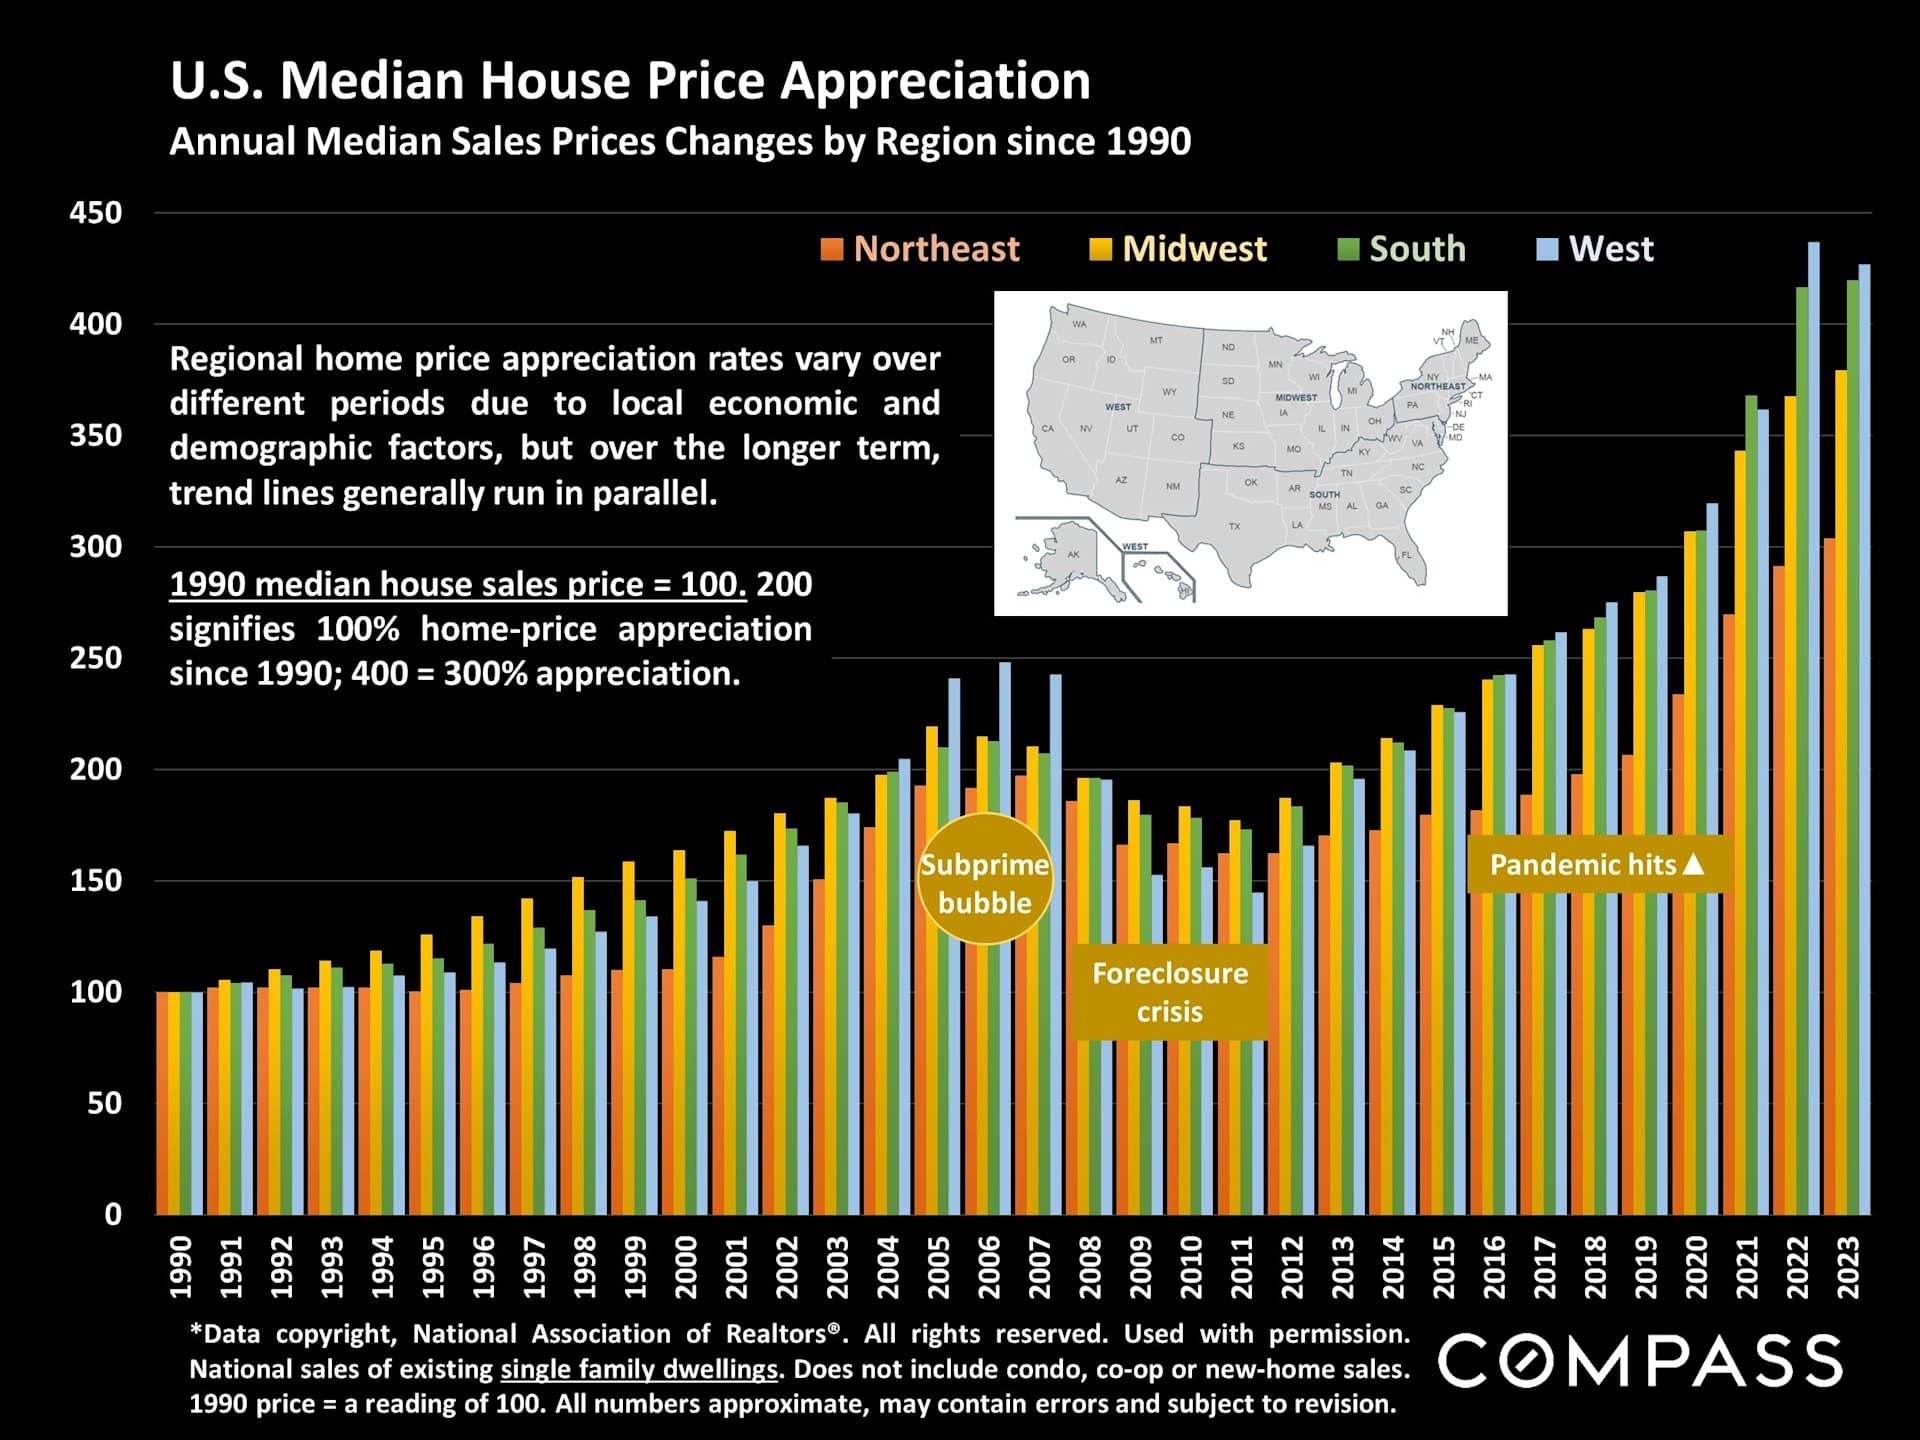
Annual median house prices for the 4 U.S. regions: Prices & appreciation rates vary due to local conditions, but because of national macroeconomic factors, regional trends up and down are usually quite similar over the longer term.
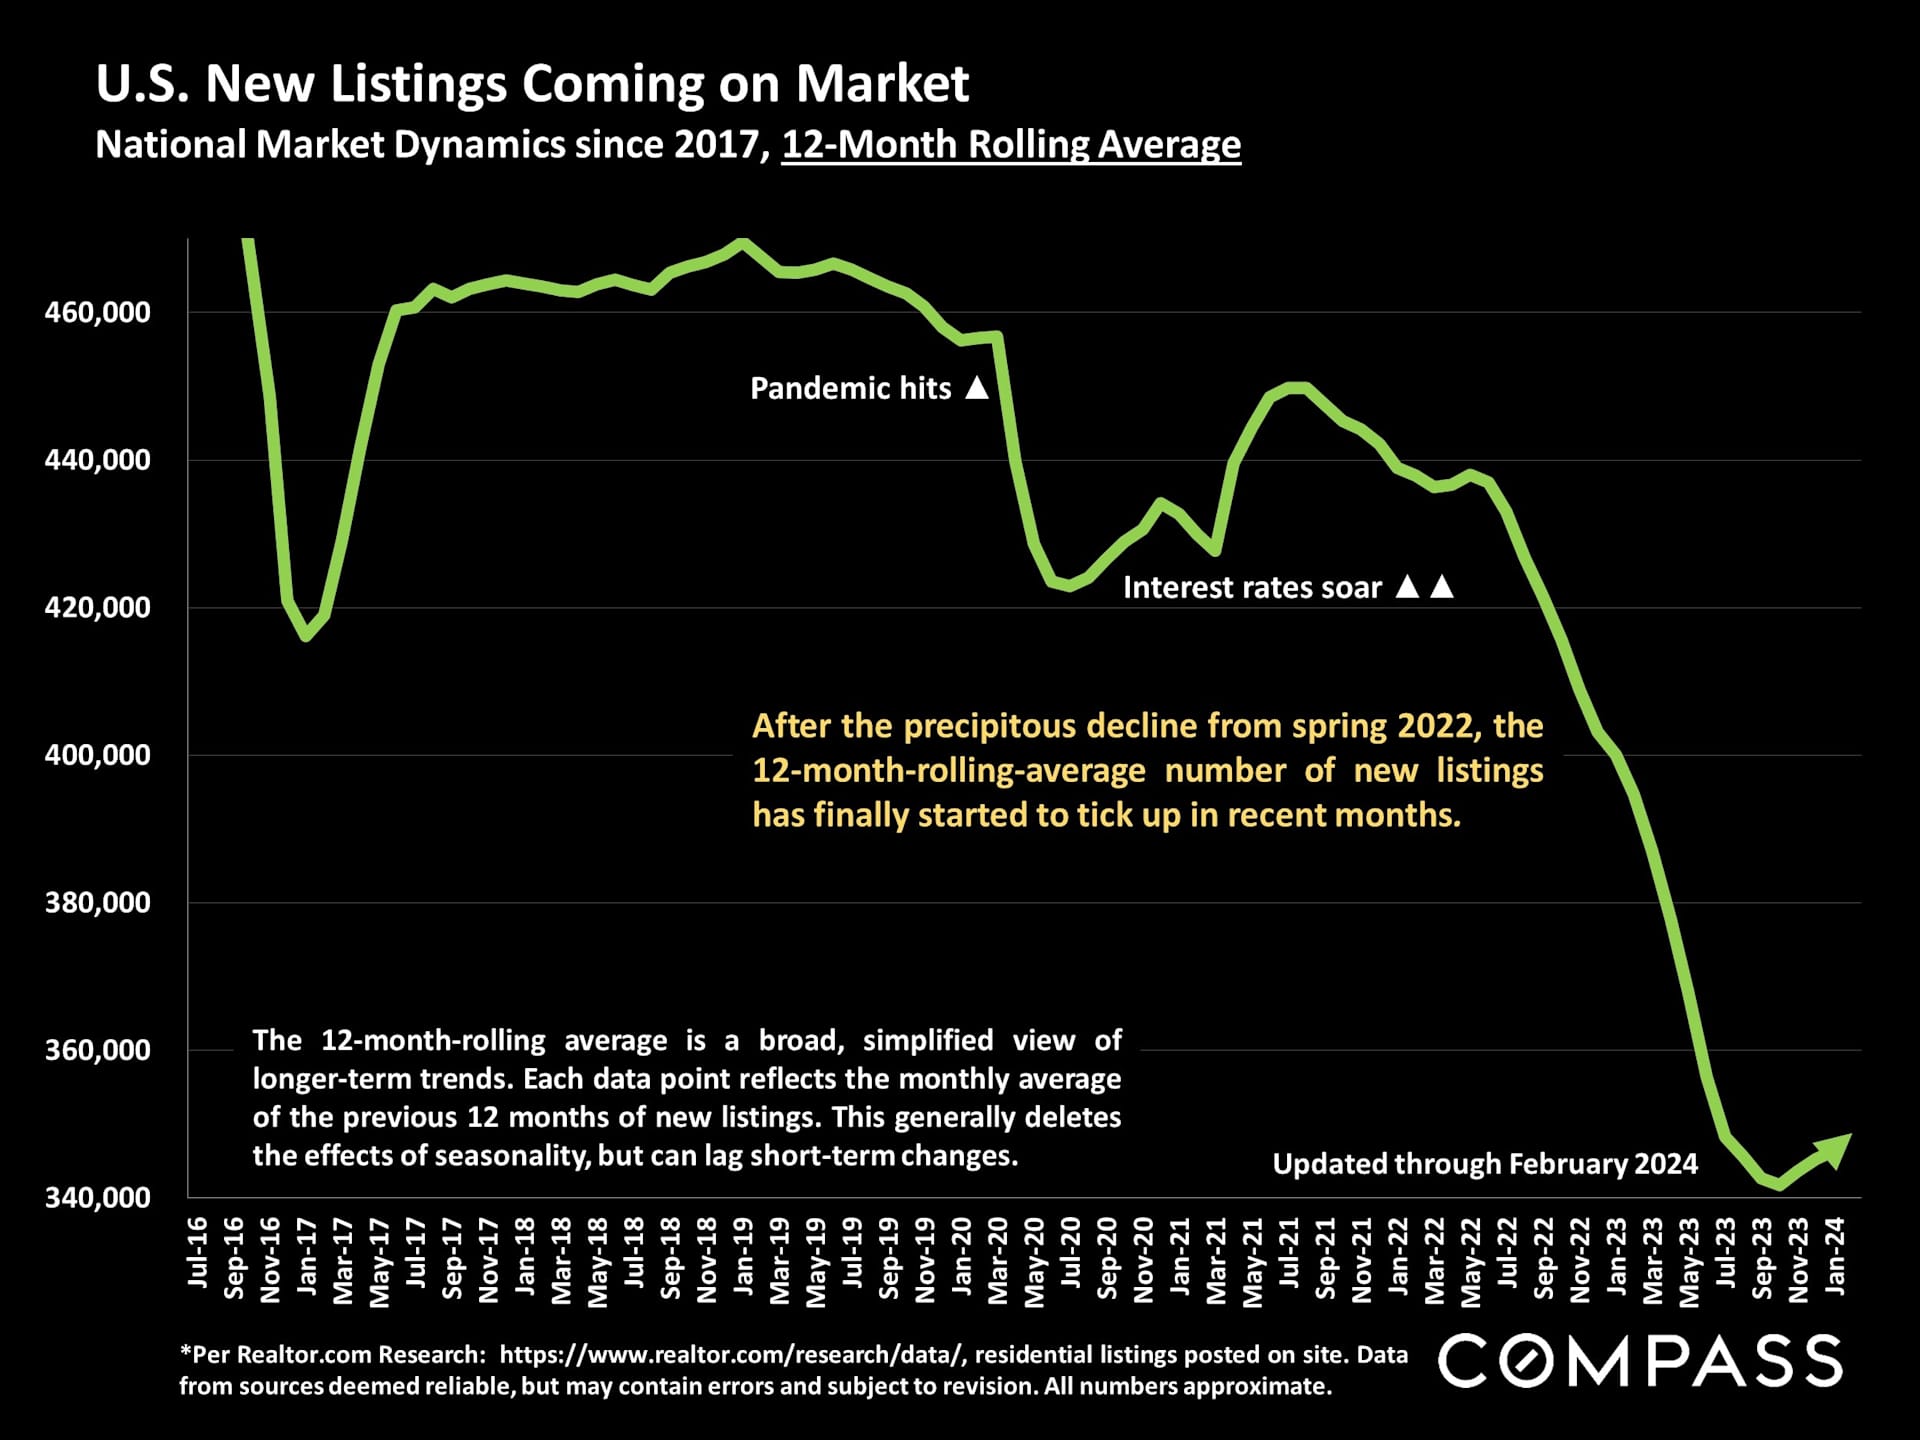
A broad illustration of the 12-month-rolling, average number of new listings coming on market: After falling for 18 months, the trend line is finally turning up again. On a single-month basis, new-listing numbers typically climb rapidly through spring.
A broad, 12-month-rolling illustration of how quickly listings have sold since 2011: Not as fast currently as during the (overheated) pandemic boom, but very fast by long-term standards. On a single-month basis - not illustrated here - days on market fluctuate by month, usually hitting their lowest readings in spring.

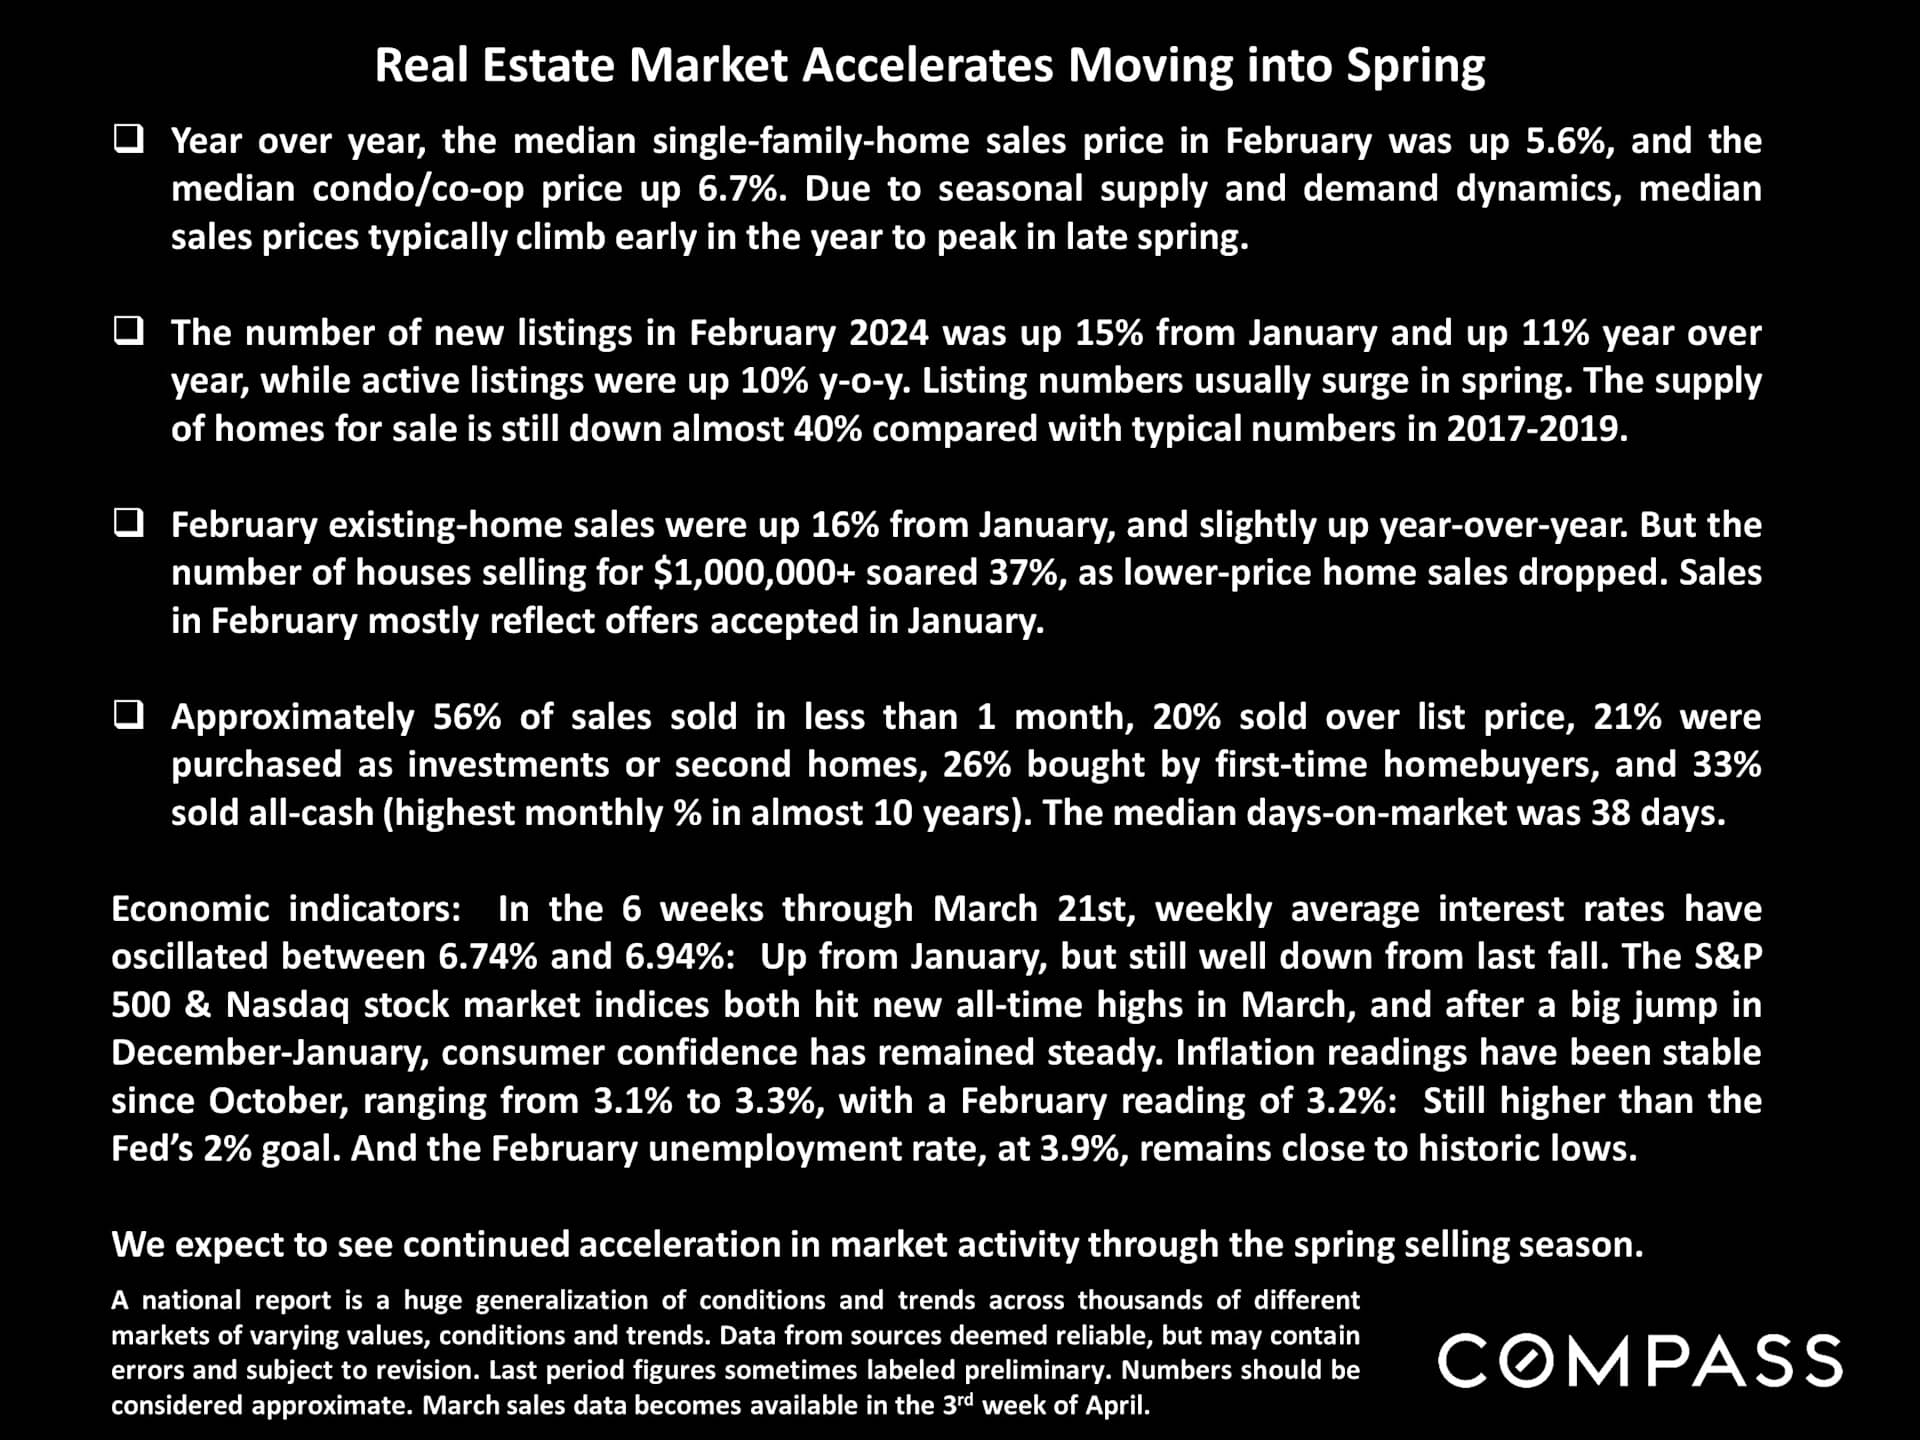
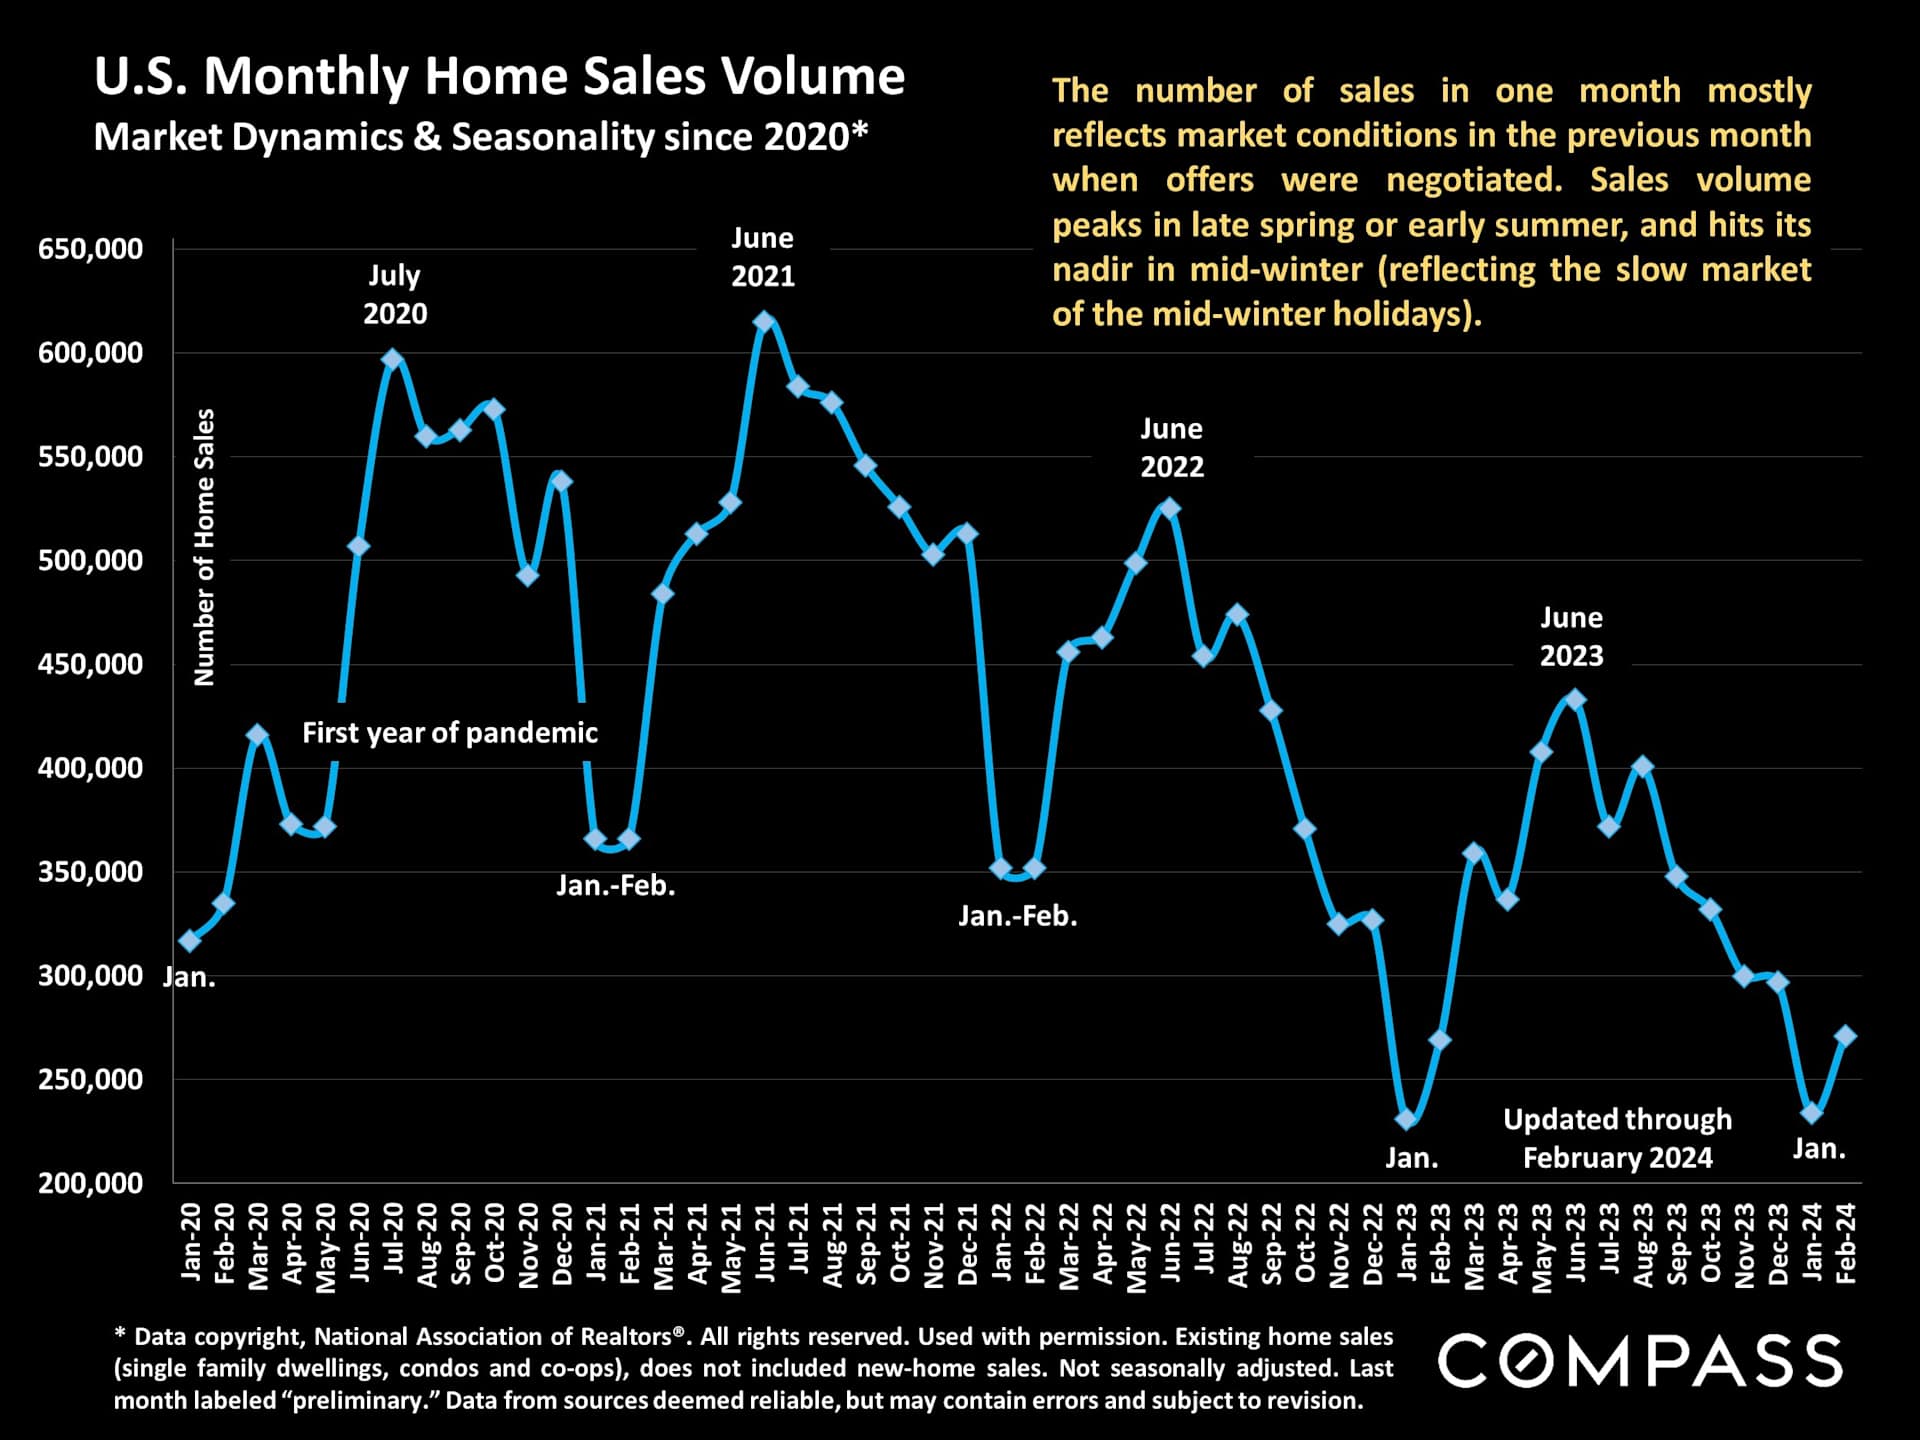
The number of sales is rebounding from its usual mid-winter low, and will continue to increase through spring, but interest rates and the extremely low inventory of listings for sale have caused a large decline in sales volumes.
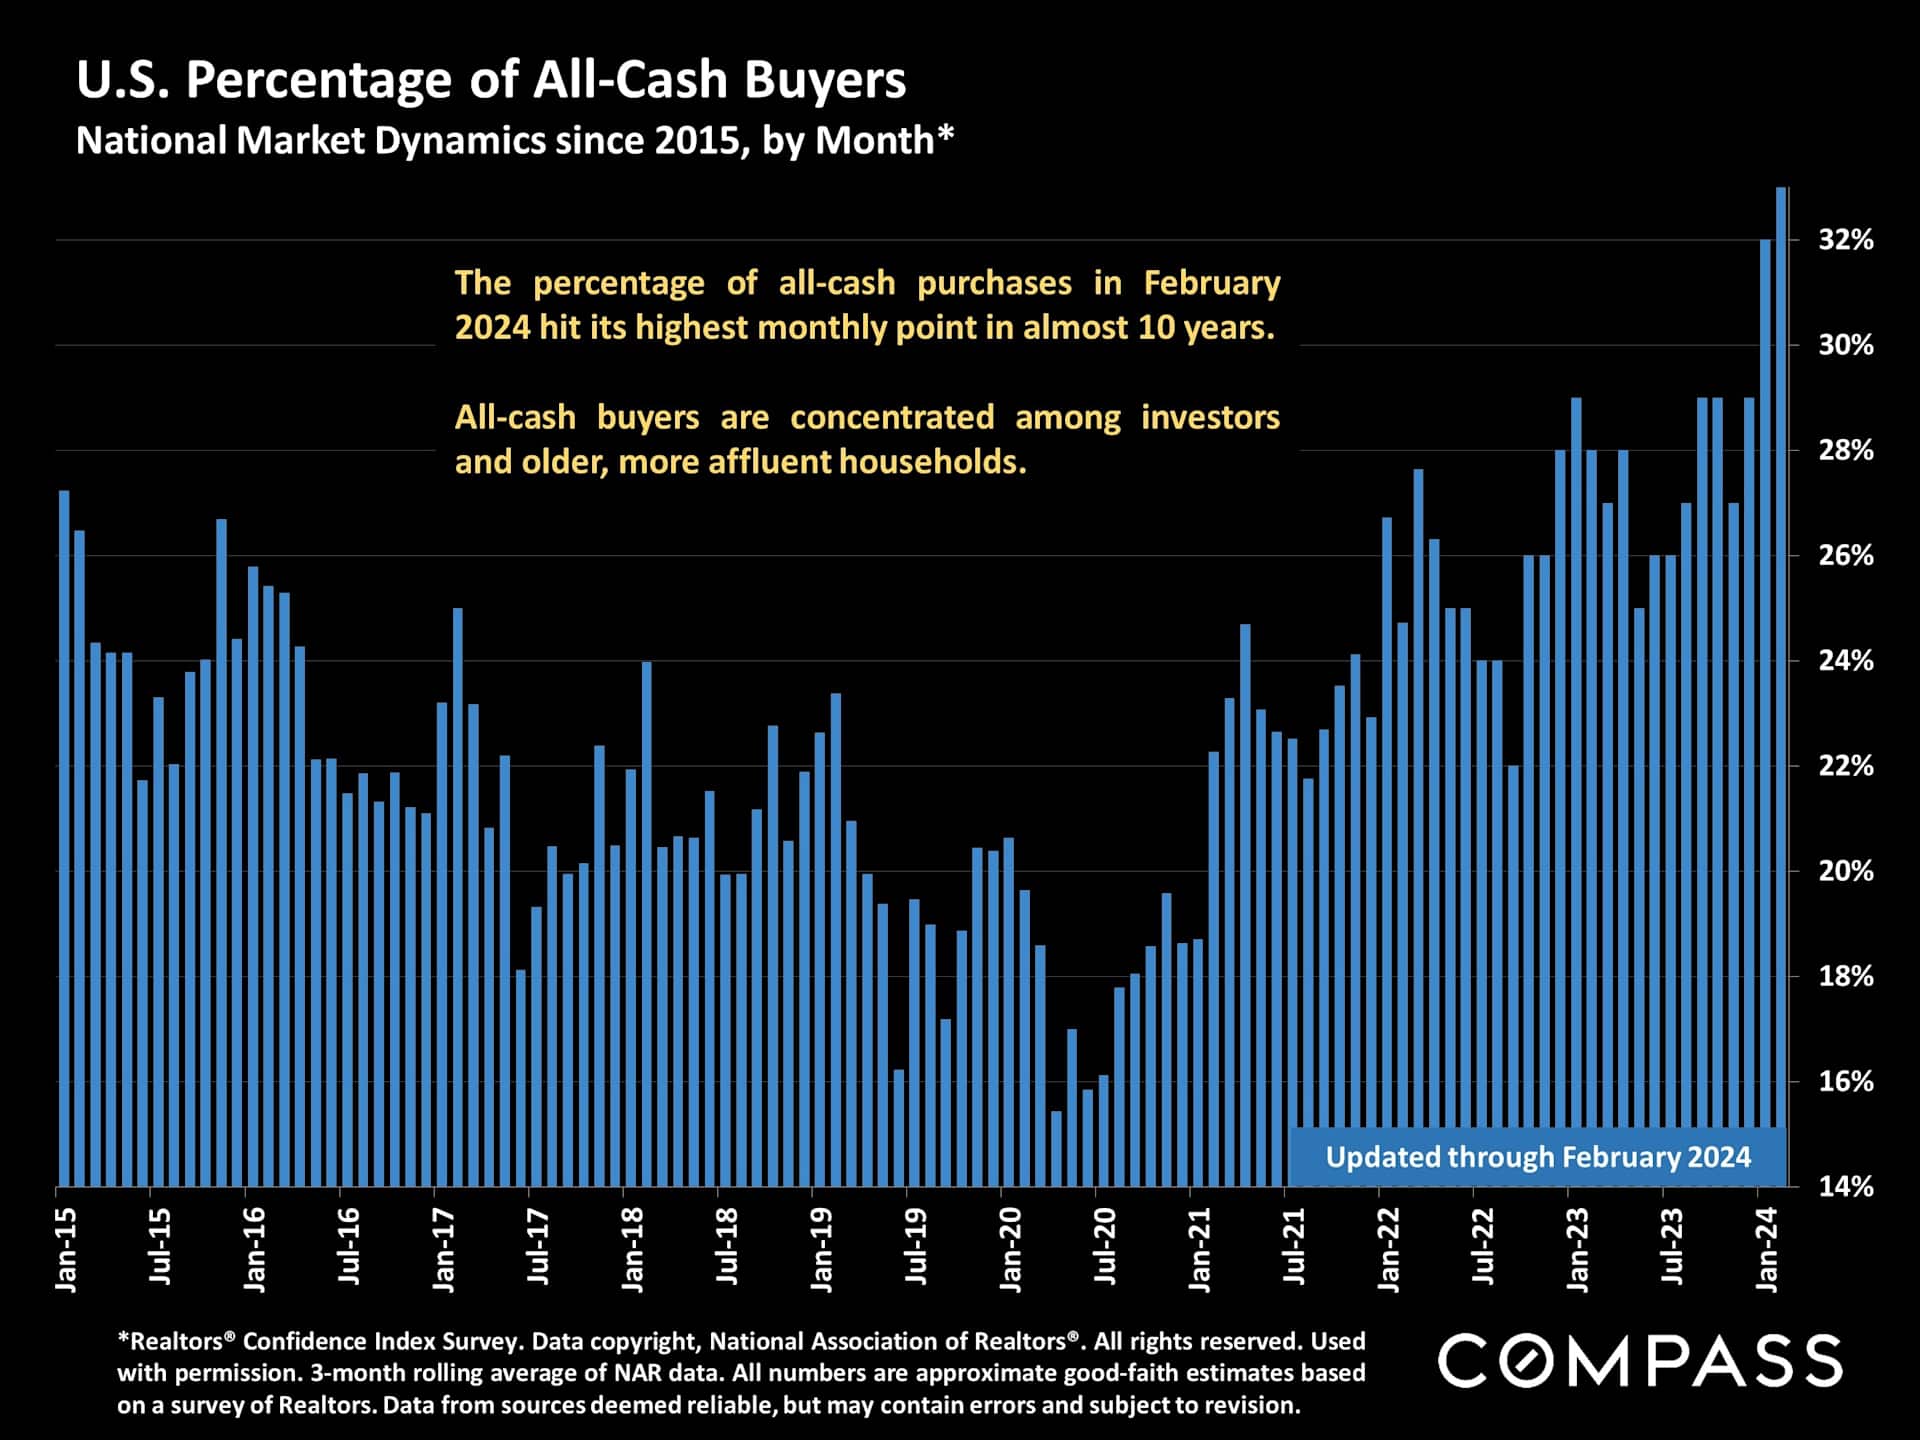
The percentage of homes selling all-cash has continued to rise. First-time homebuyers have faced increasing competition from investors and more affluent homebuyers with the ability to purchase without a loan.
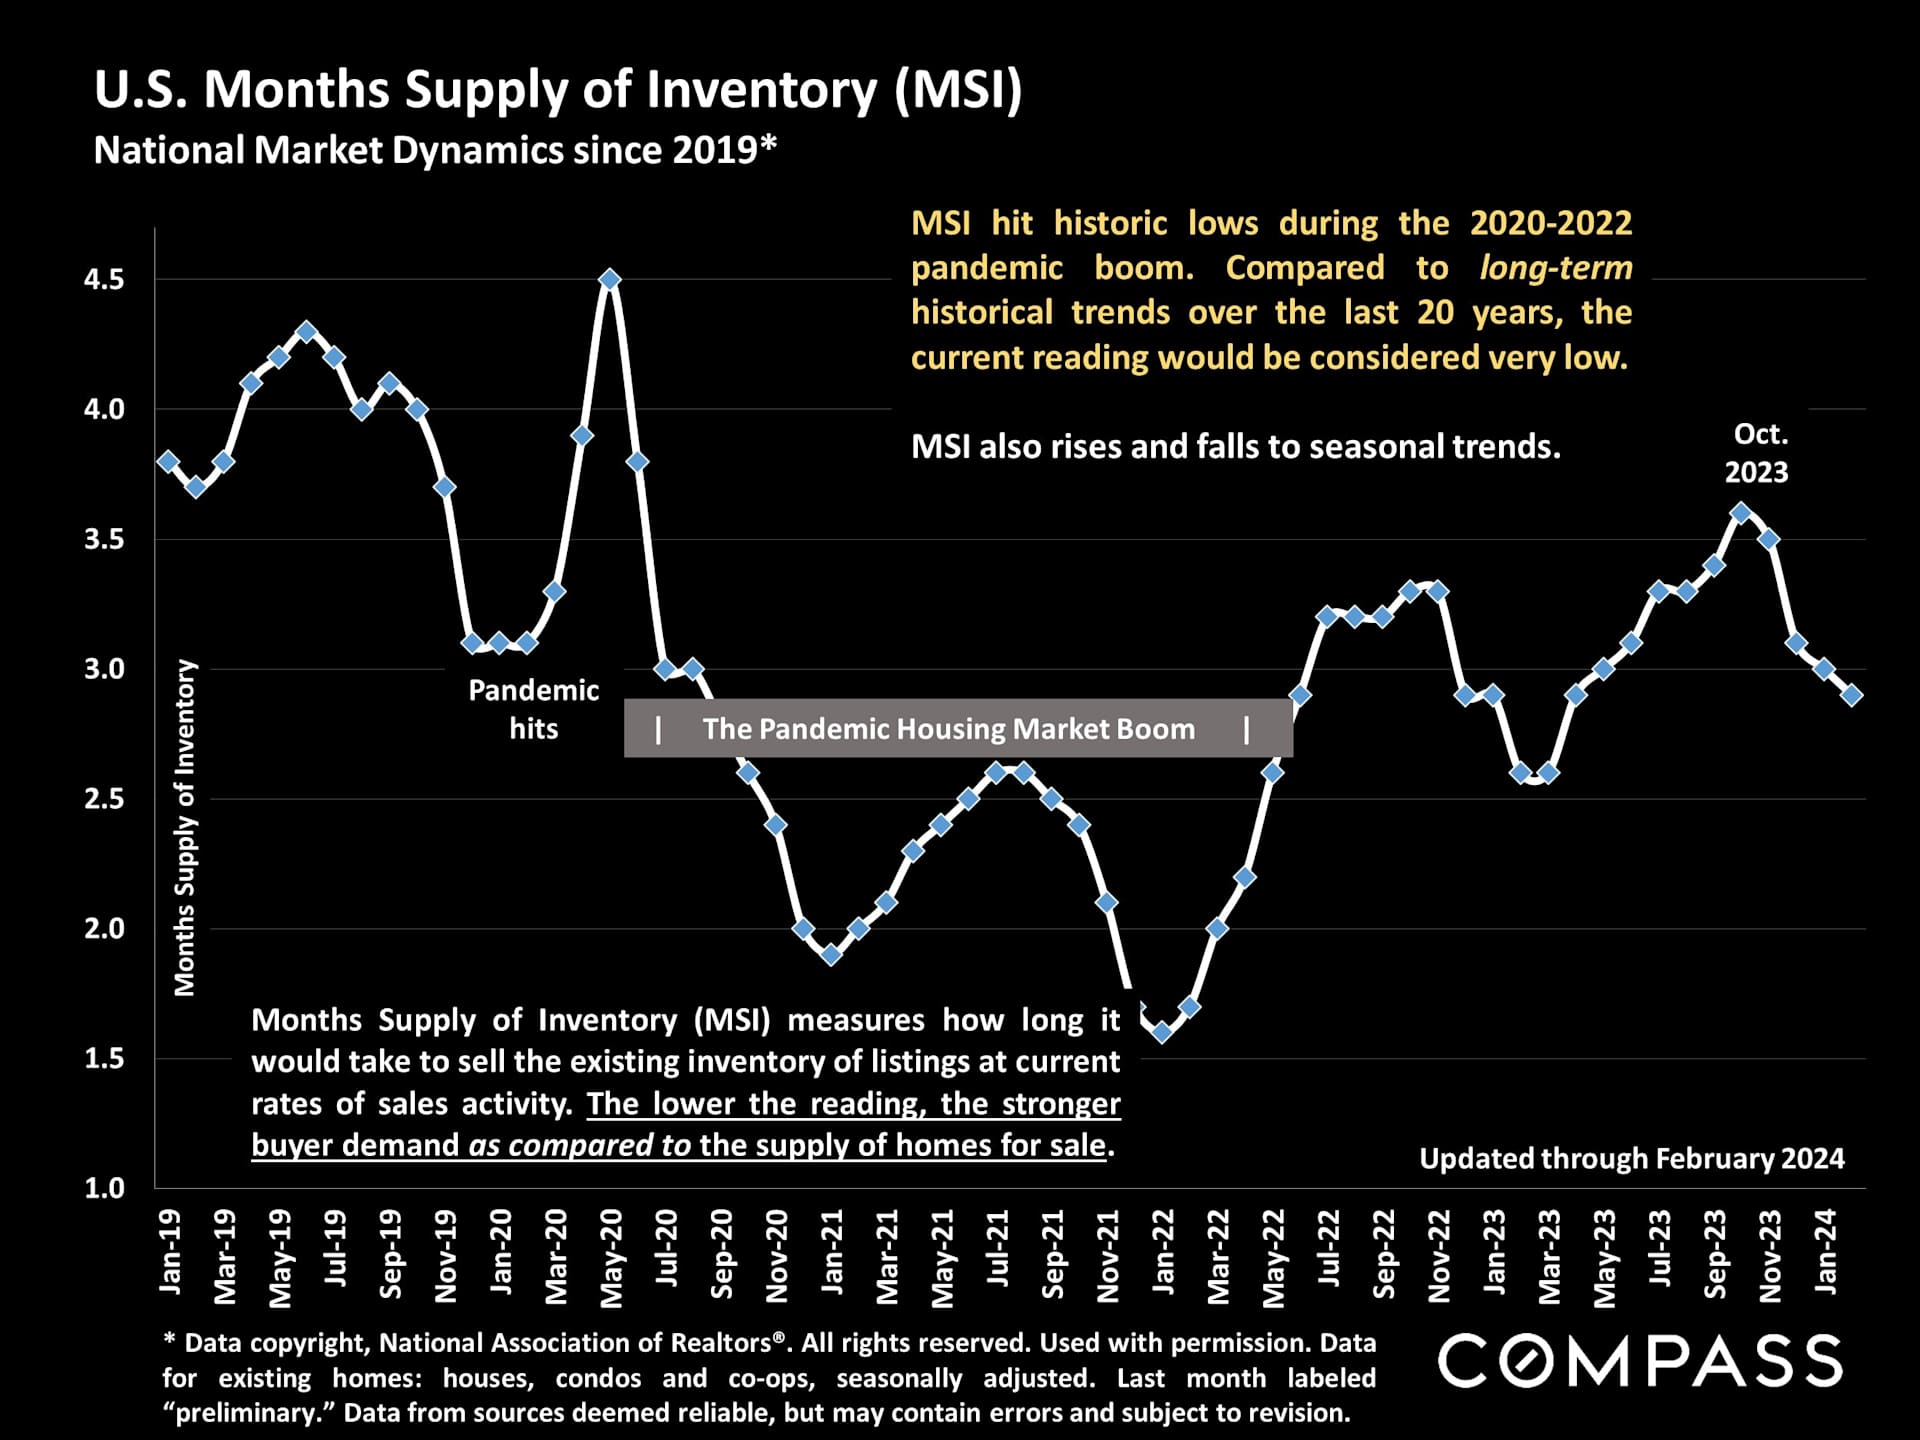
Months-supply-of-inventory compares buyer demand to the supply of homes for sale: The lower the reading, the more competitive the market. The current reading of 2.9 months, though higher than during the pandemic boom, is very low by pre-pandemic norms - mostly due to the inadequate supply of listings.
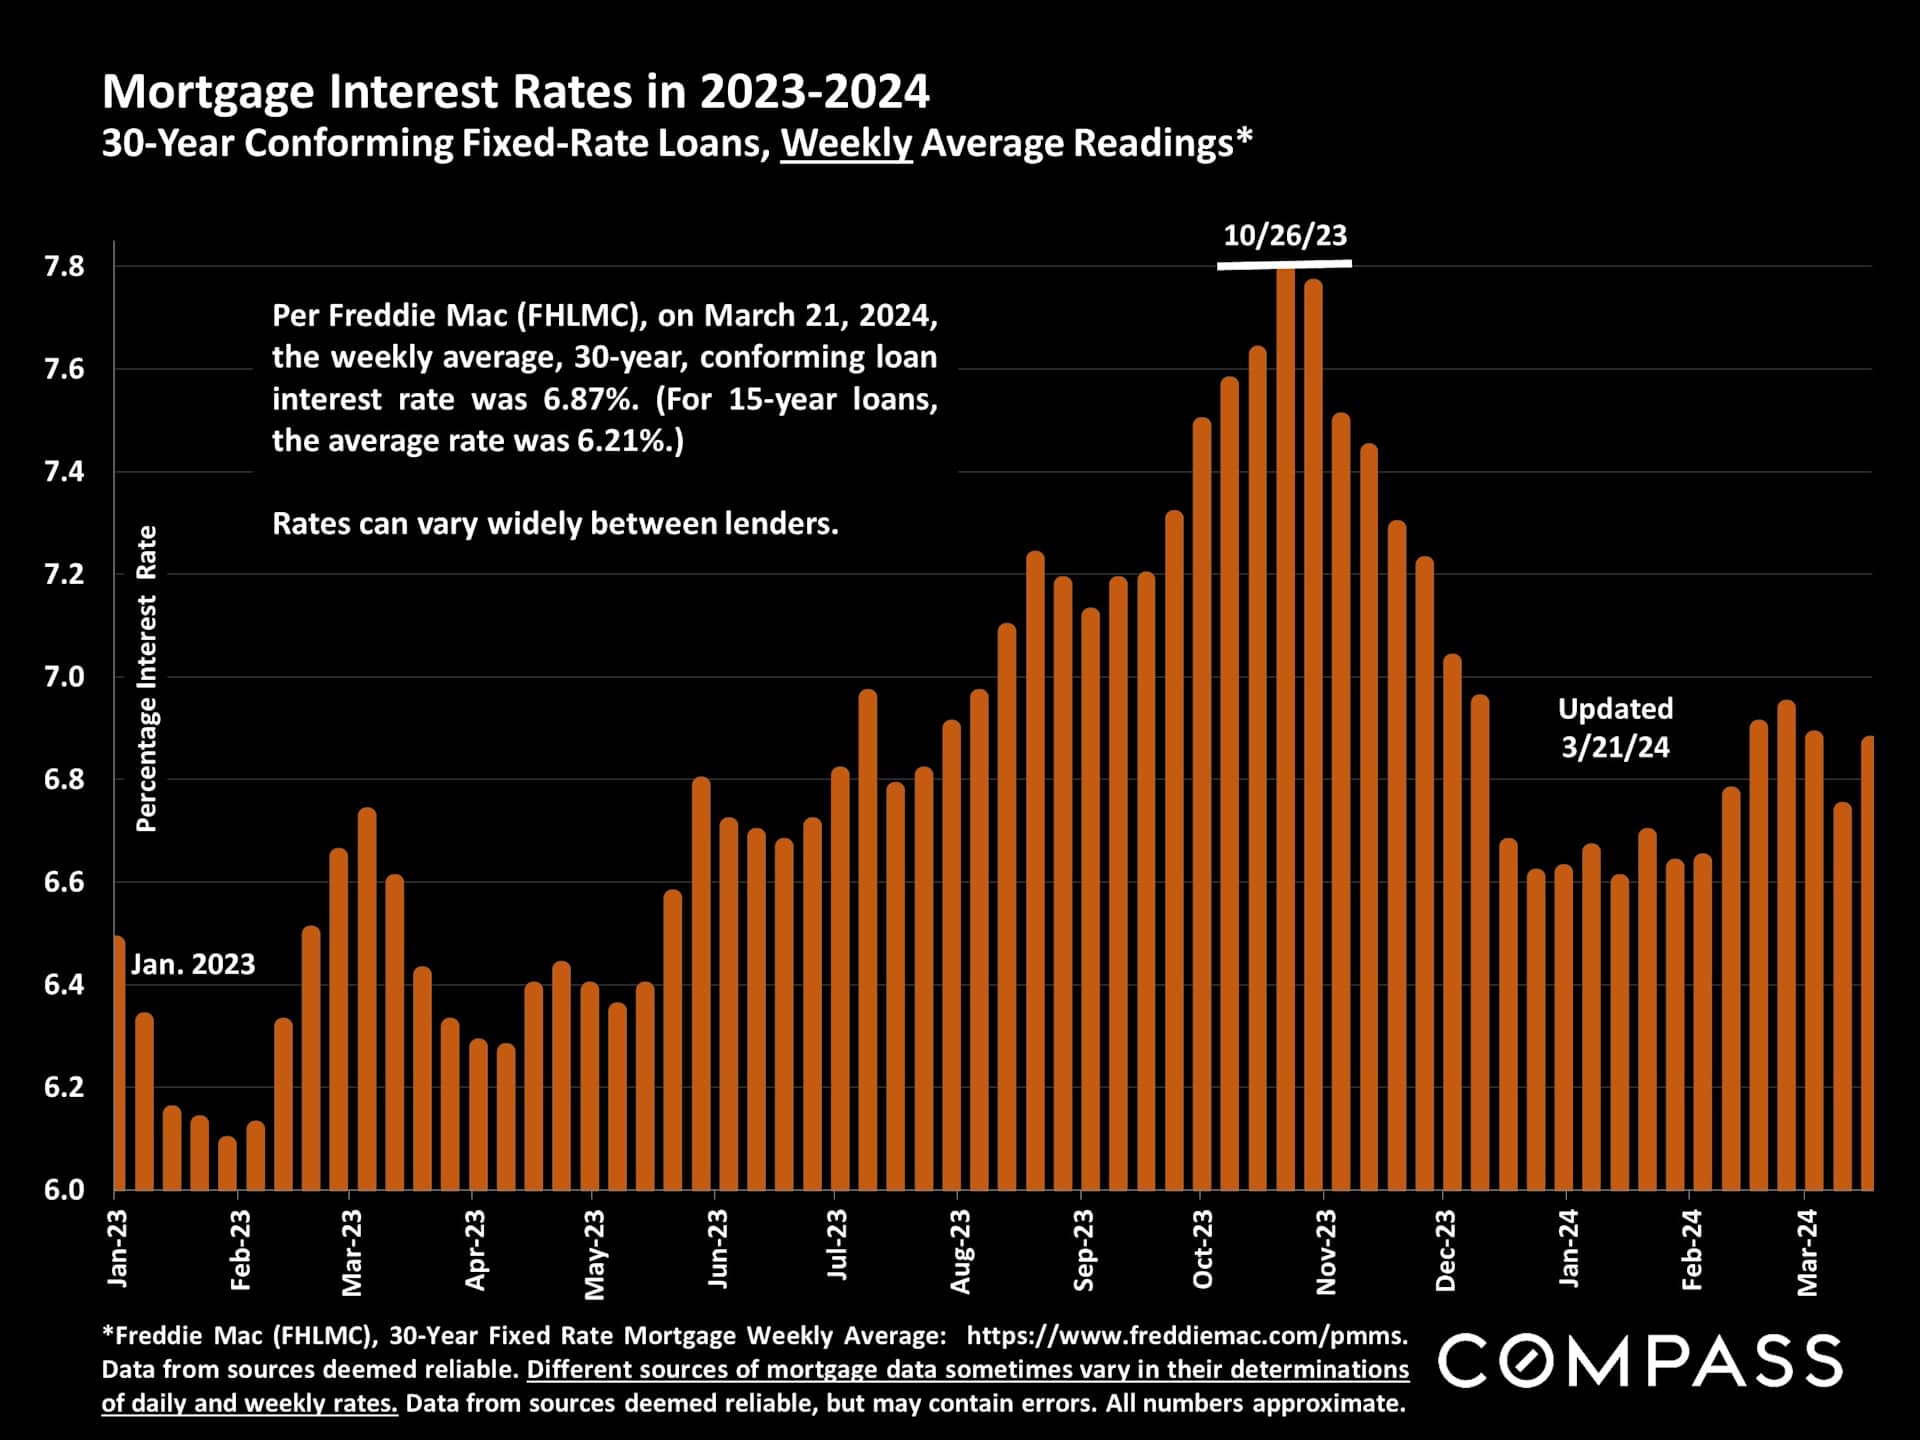
After the large decline from late October, mortgage interest rates have been fluctuating within a relatively narrow range of values in 2024.
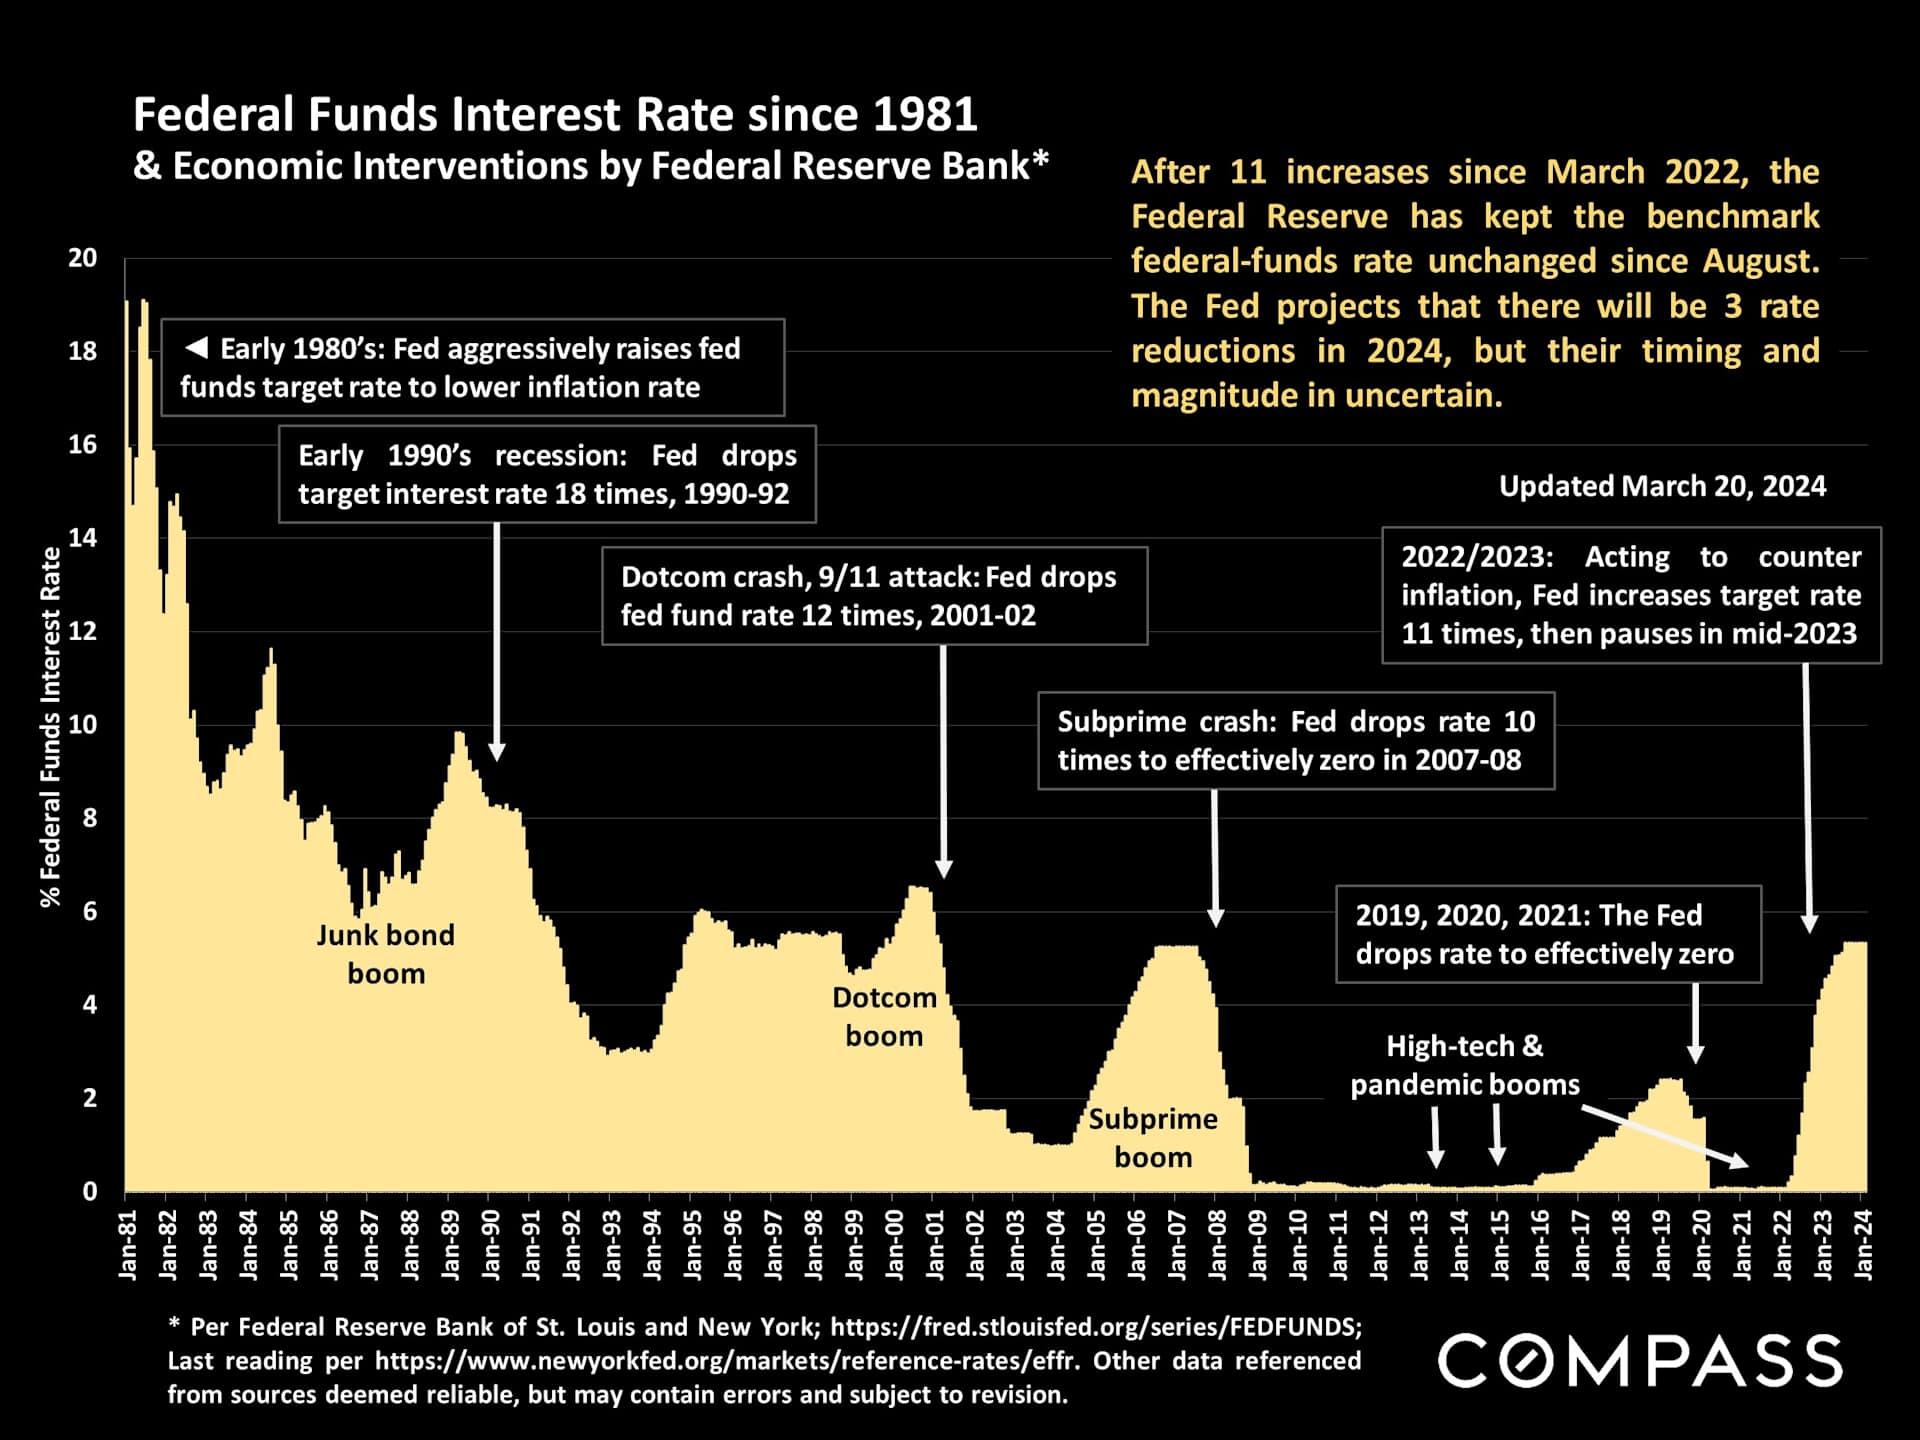
For decades, the Federal Reserve Bank has played a huge role in financial and housing markets via the setting of their benchmark rate. Inflation has plunged since mid-2022, but remains higher than the Fed likes, and this has kept the Fed in a holding pattern since August. Rate reductions are still expected to occur in 2024.
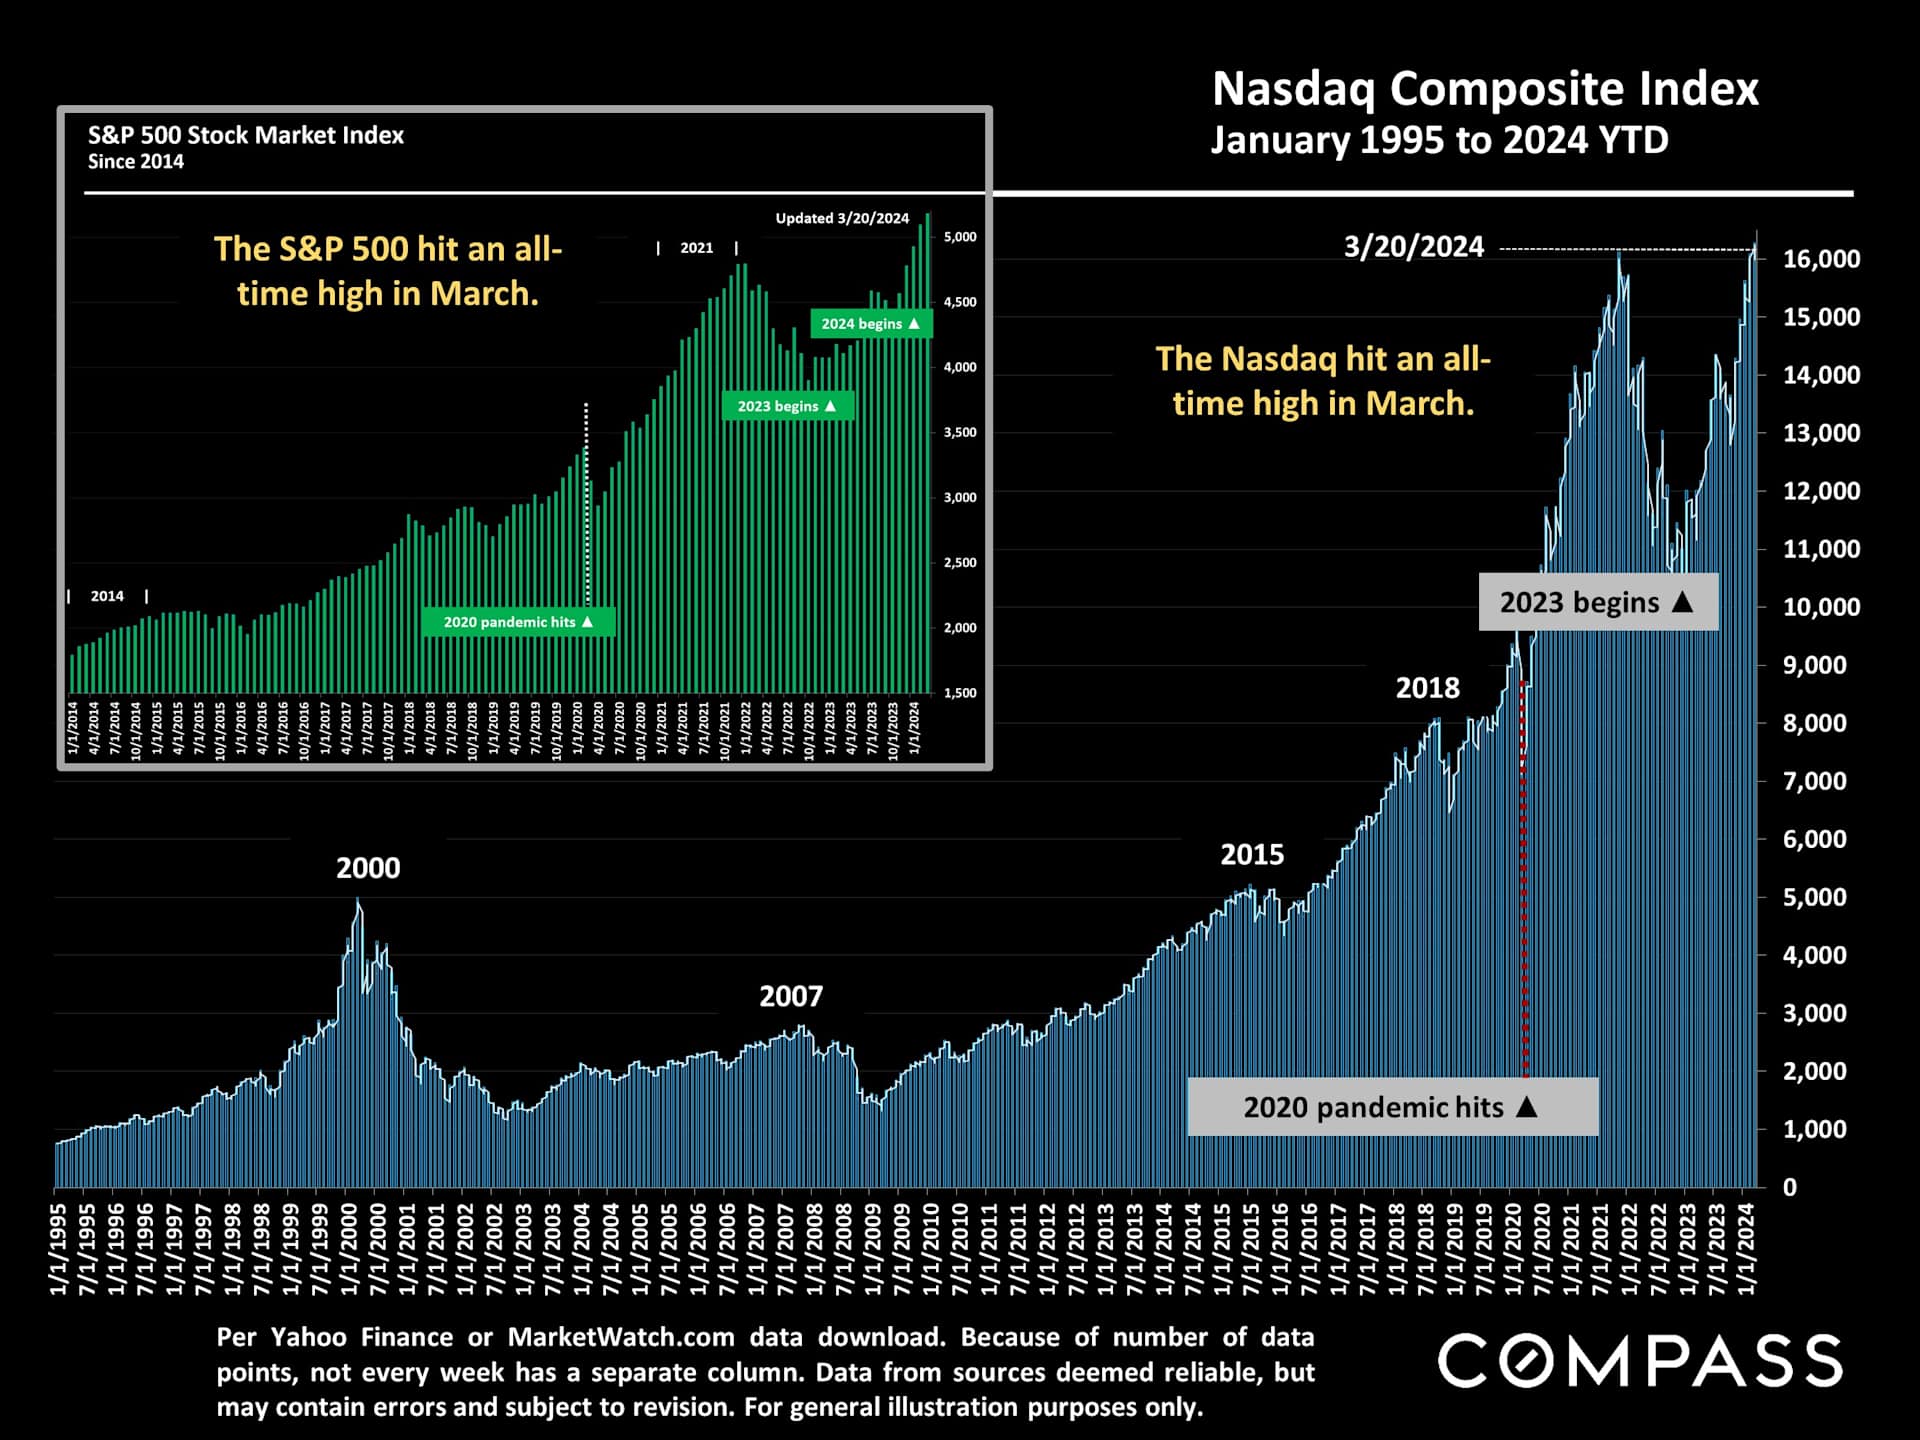
Stock markets hit new highs in March, an enormous factor - especially for more affluent households - in wealth, consumer confidence, and the ability to pay all-cash for homes.
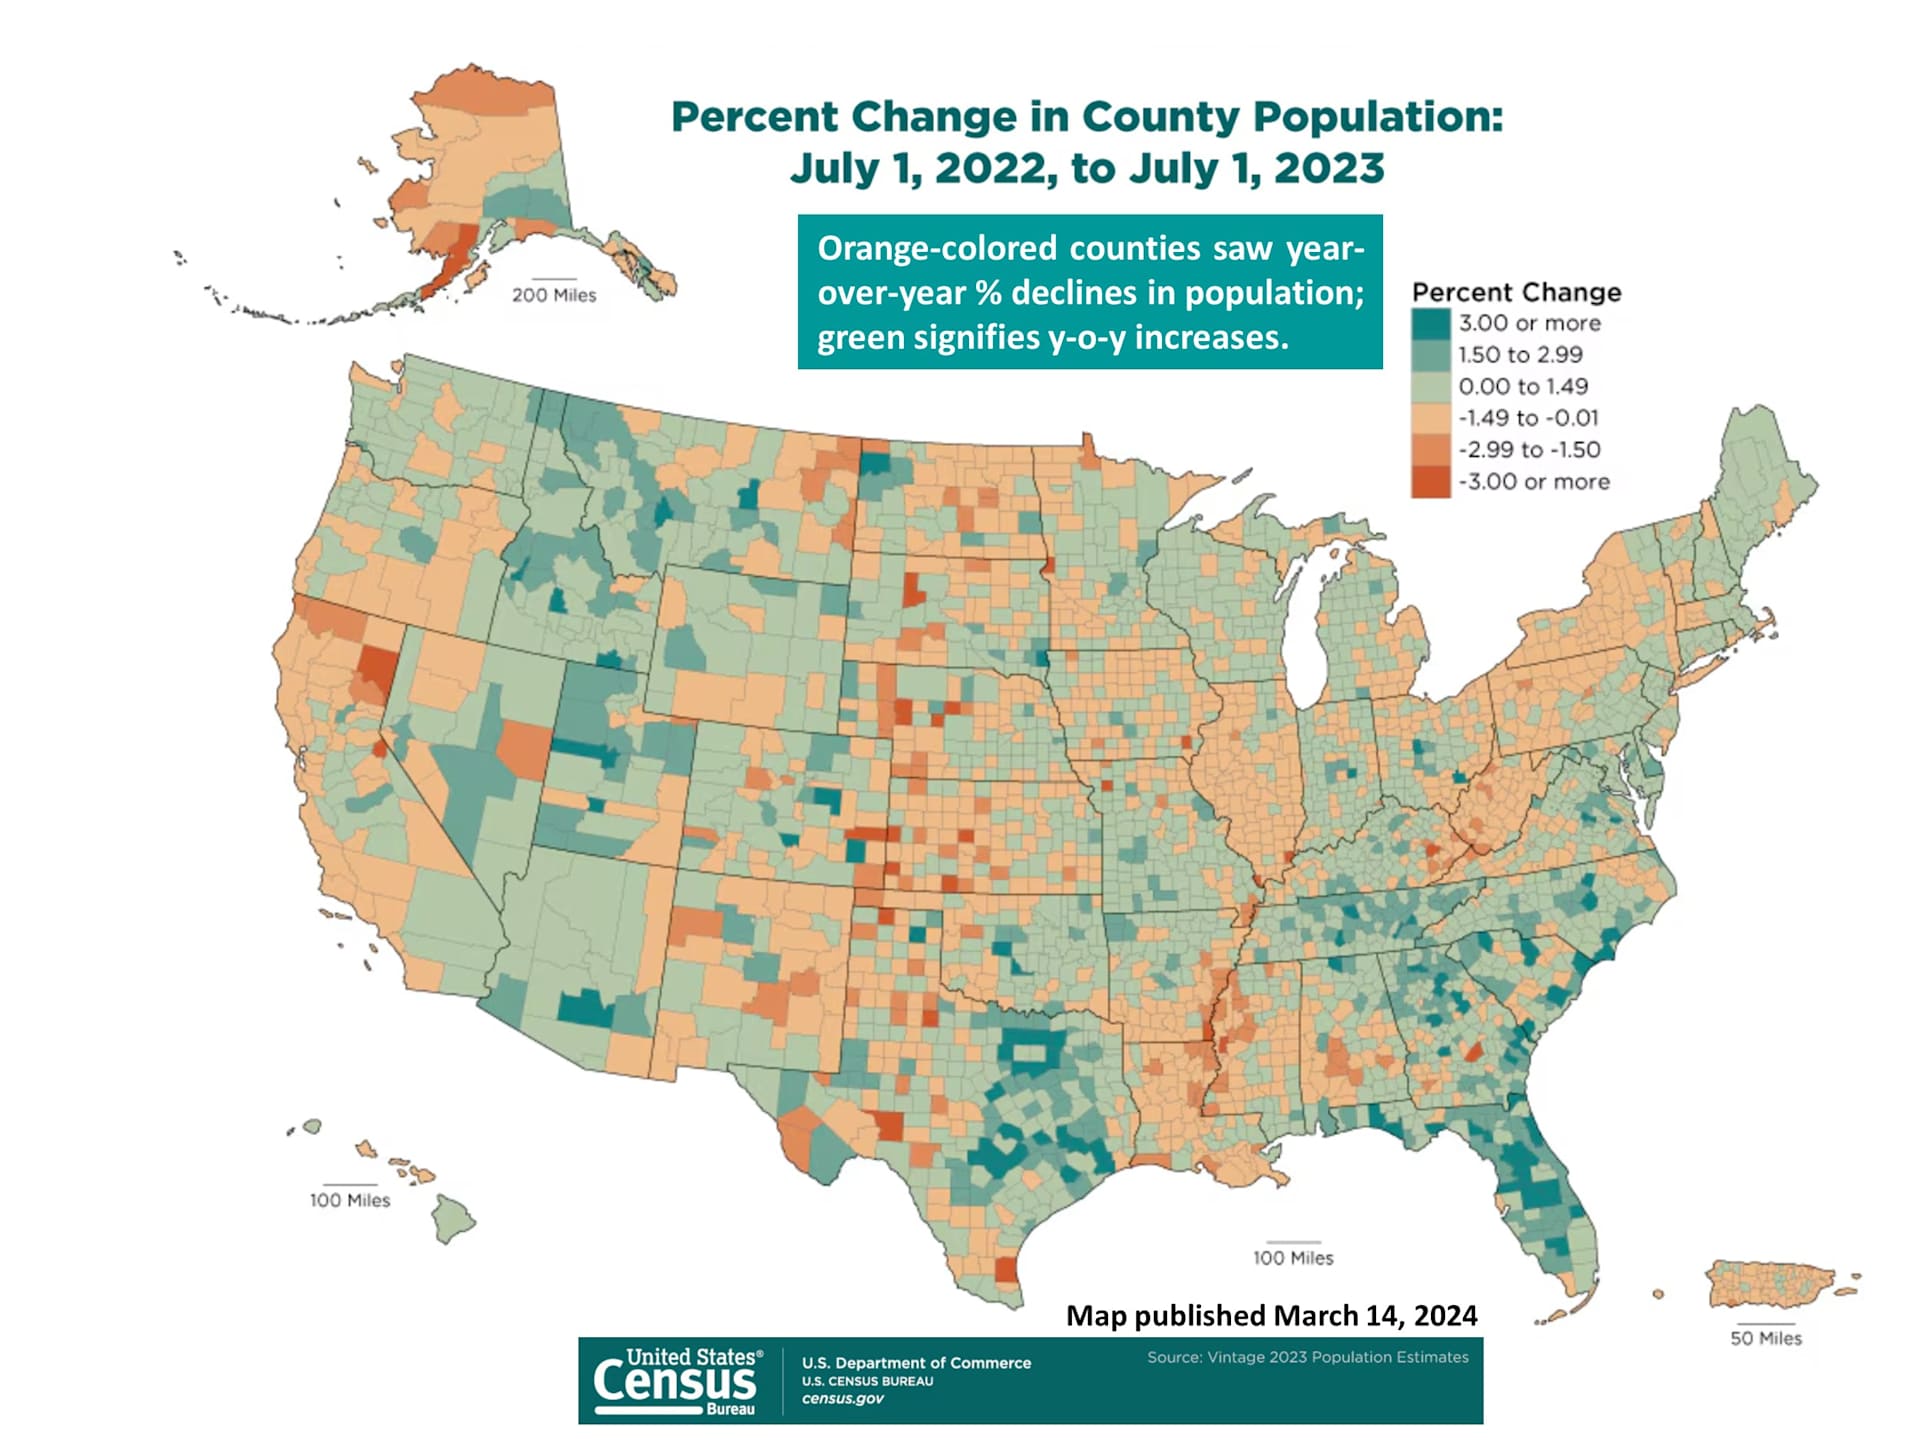
The new U.S. Census map illustrating county population changes 7/1/22 to 7/1/23: The magnitude of changes - mostly due to migration - has declined from 2020-2022, but remains a major factor in many local markets.
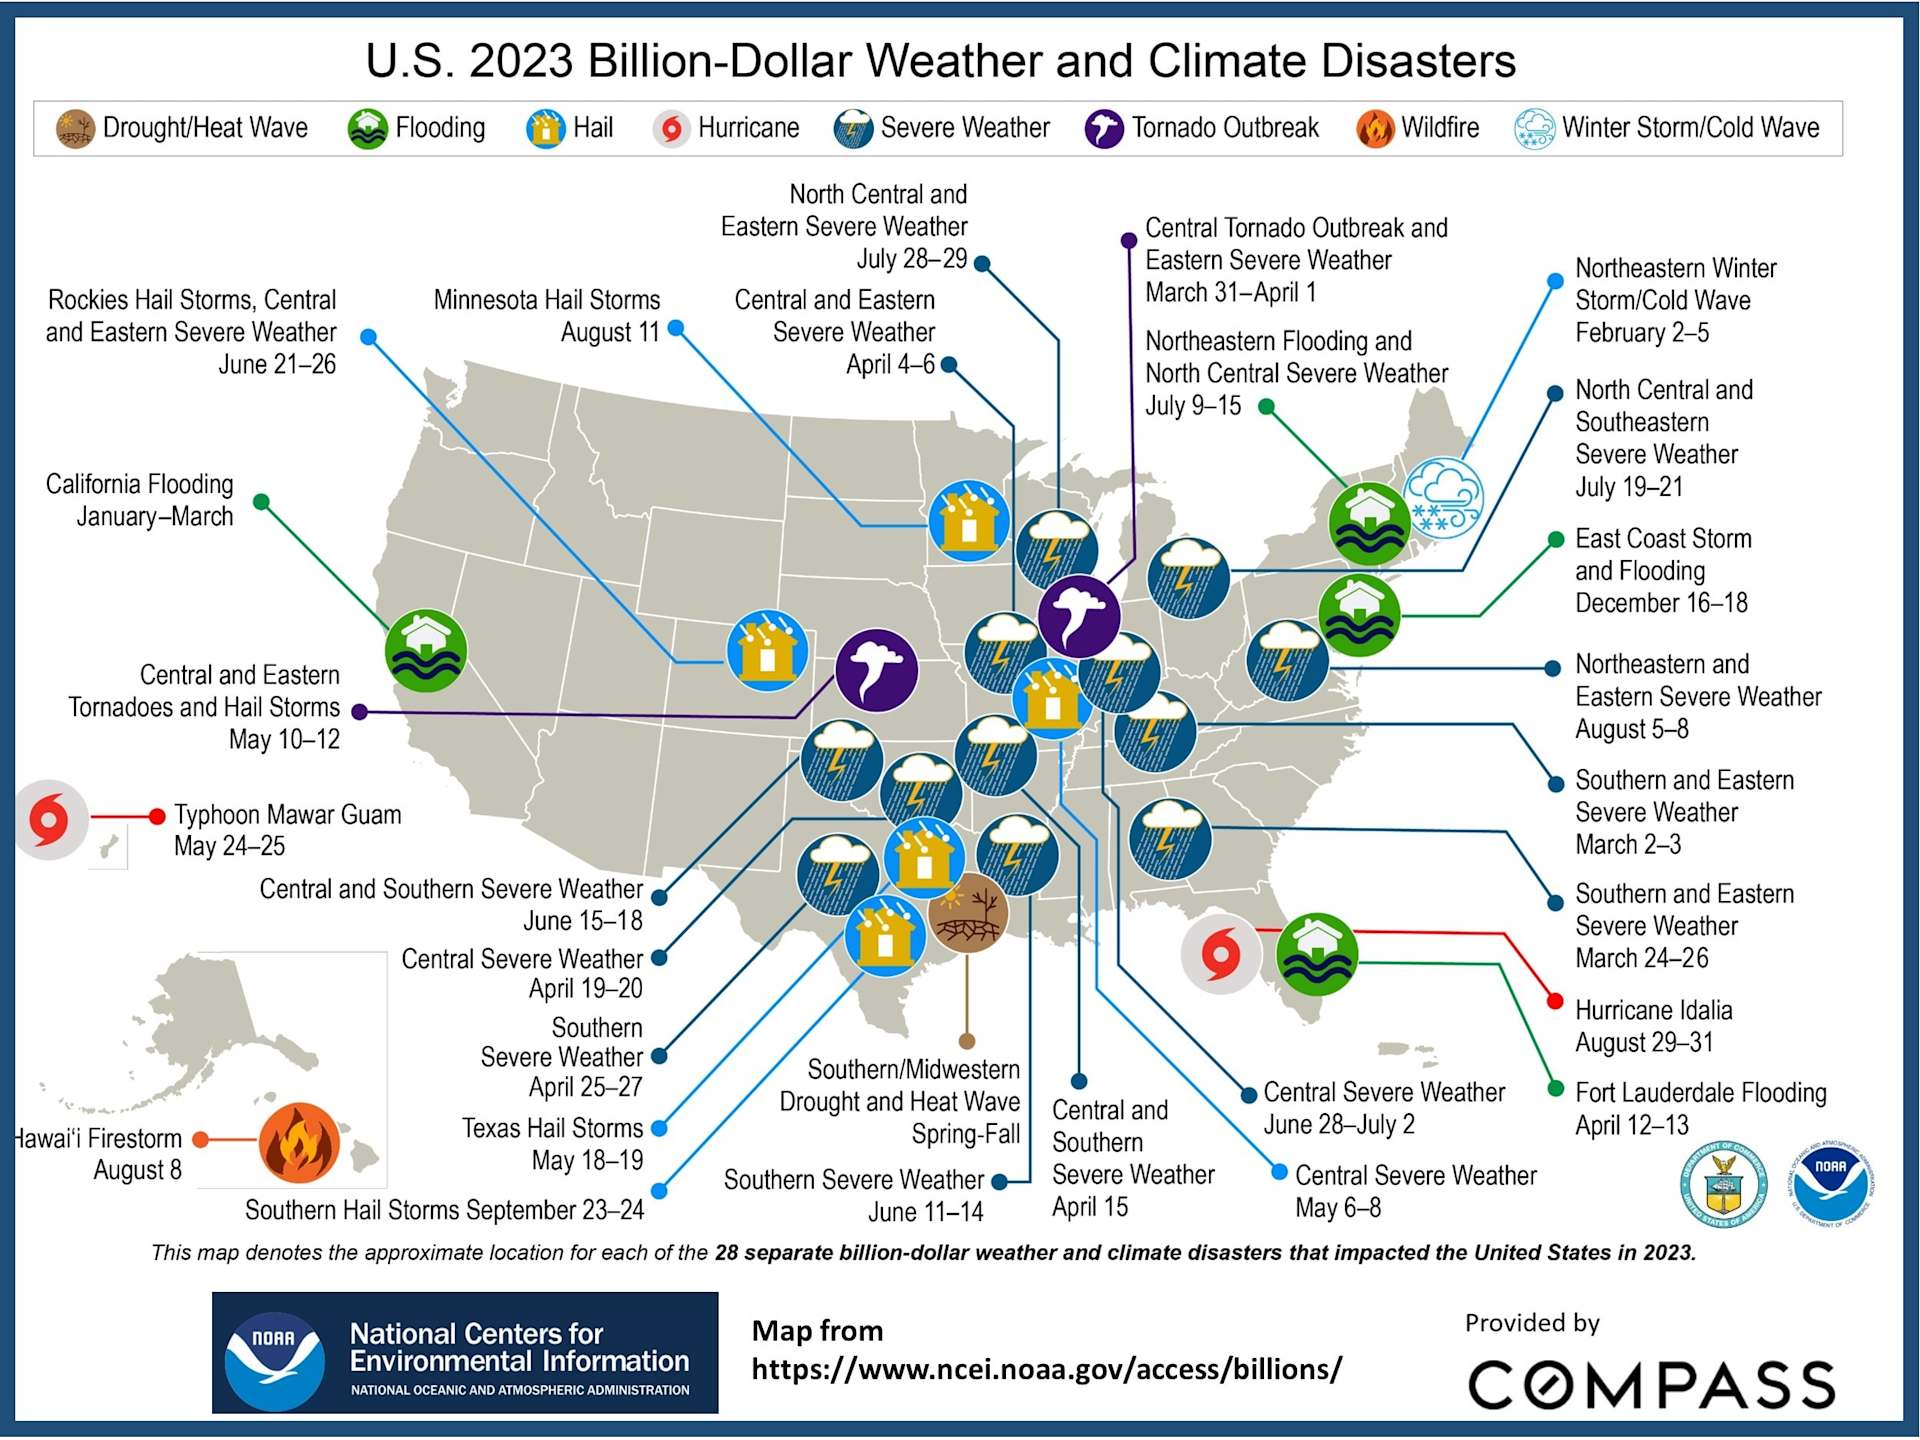
National homeowner's insurance rates have increased 23% in the last 14 months, with some communities seeing much larger hikes - to crisis points. The main factor: In inflation-adjusted dollars, the average, annual cost of "billion-dollar-plus" natural disasters has gone from $21.5 billion in the 1980's to over $144 billion in 2021-2023. Below is the NOAA billion-dollar natural disaster map for 2023.
Amid various economic ups and downs, the prevailing market dynamic since the great recession has been too few homes available to buy.