Dramatically Improving Economic Indicators Suggest a Brighter 2024 Housing Market
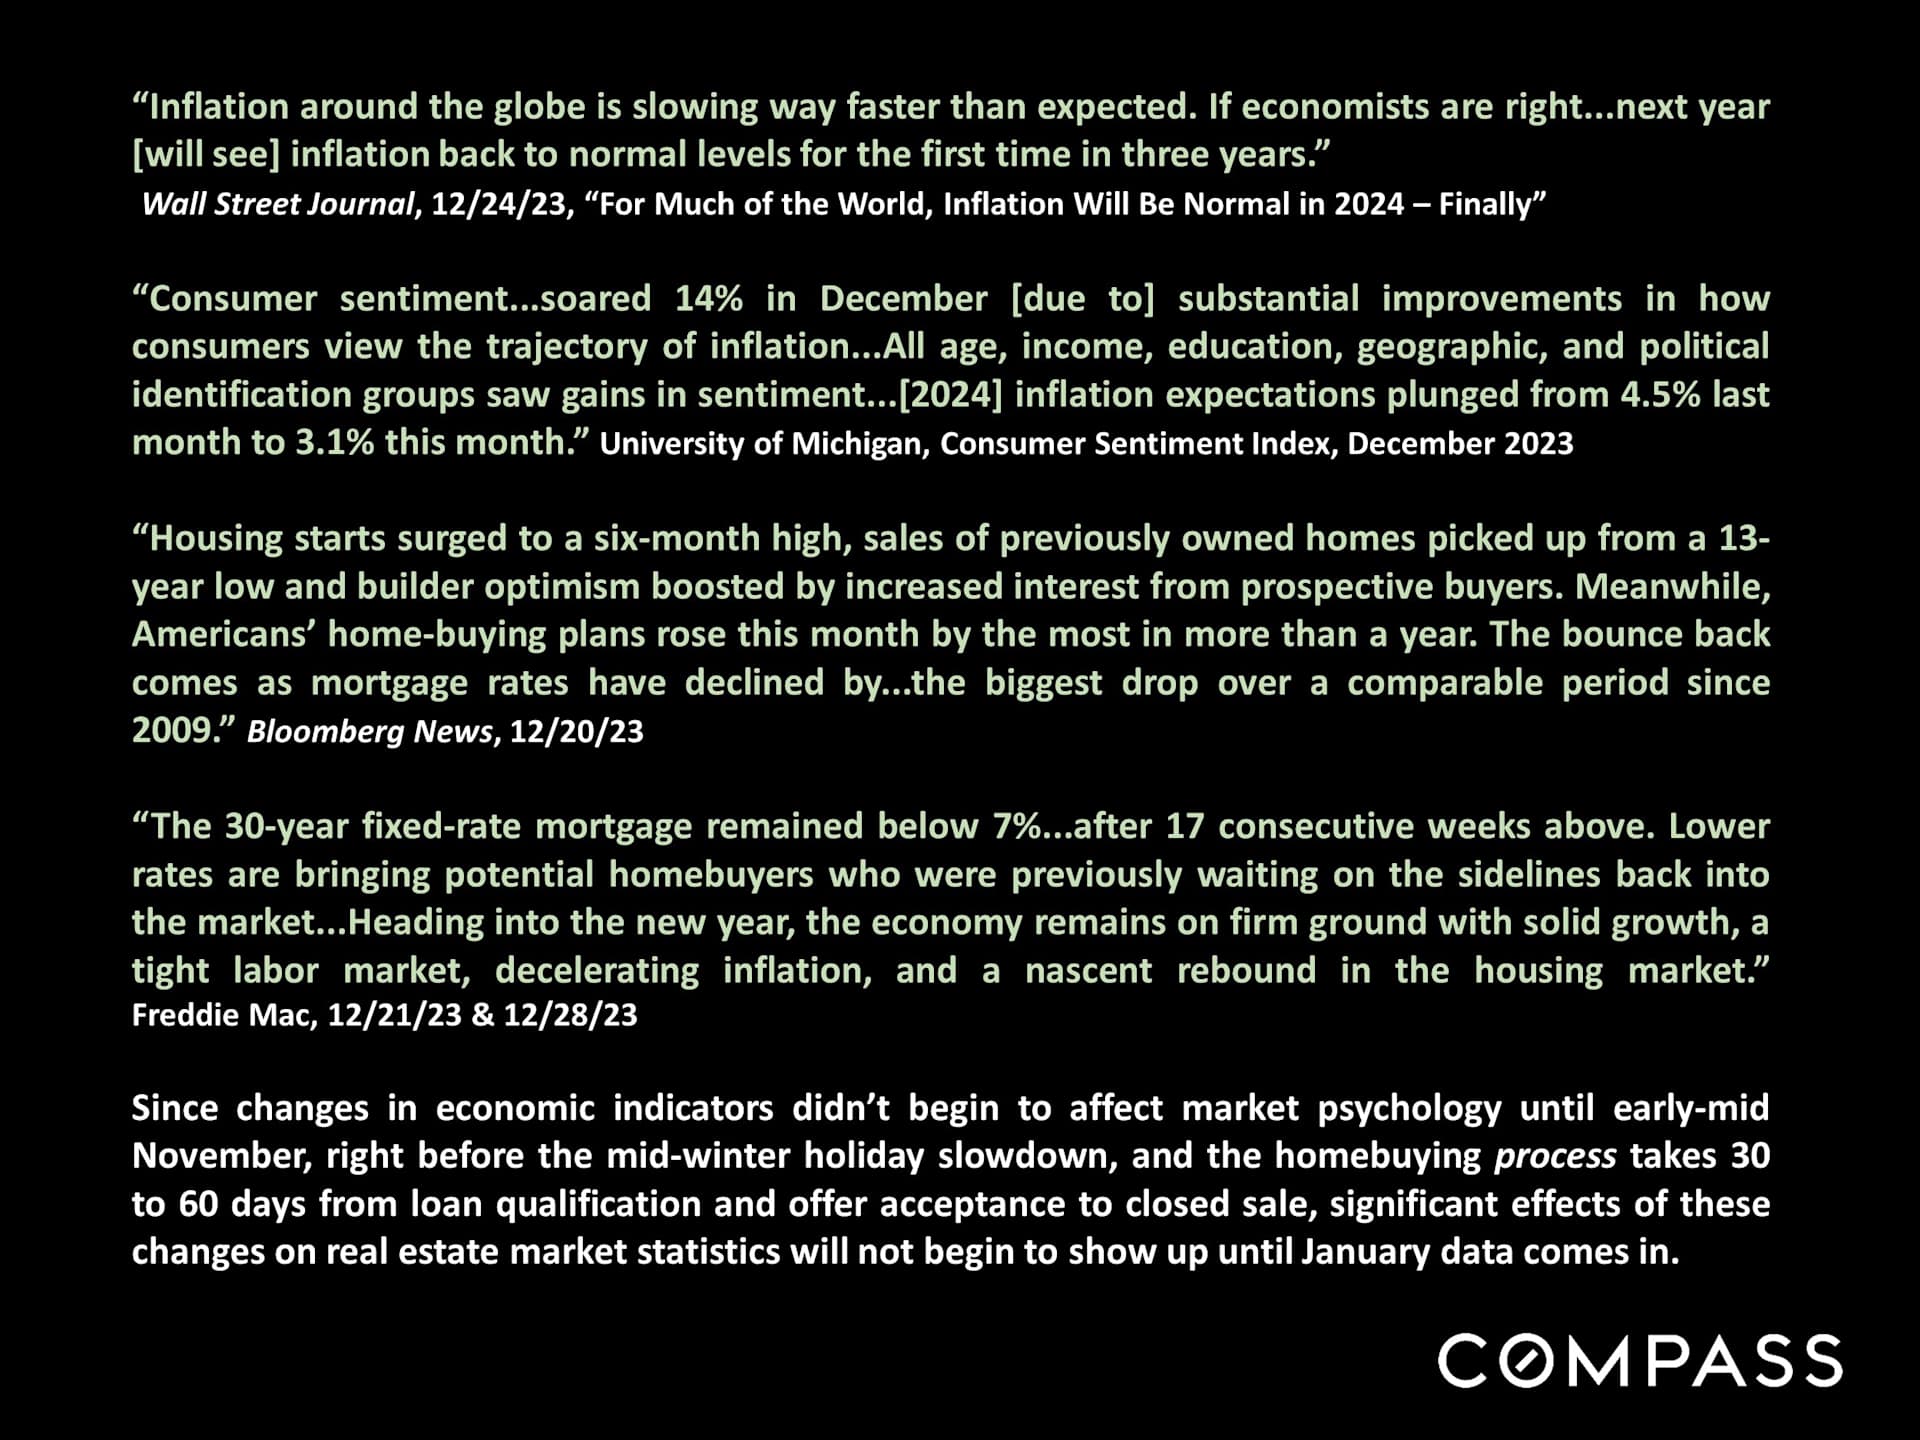
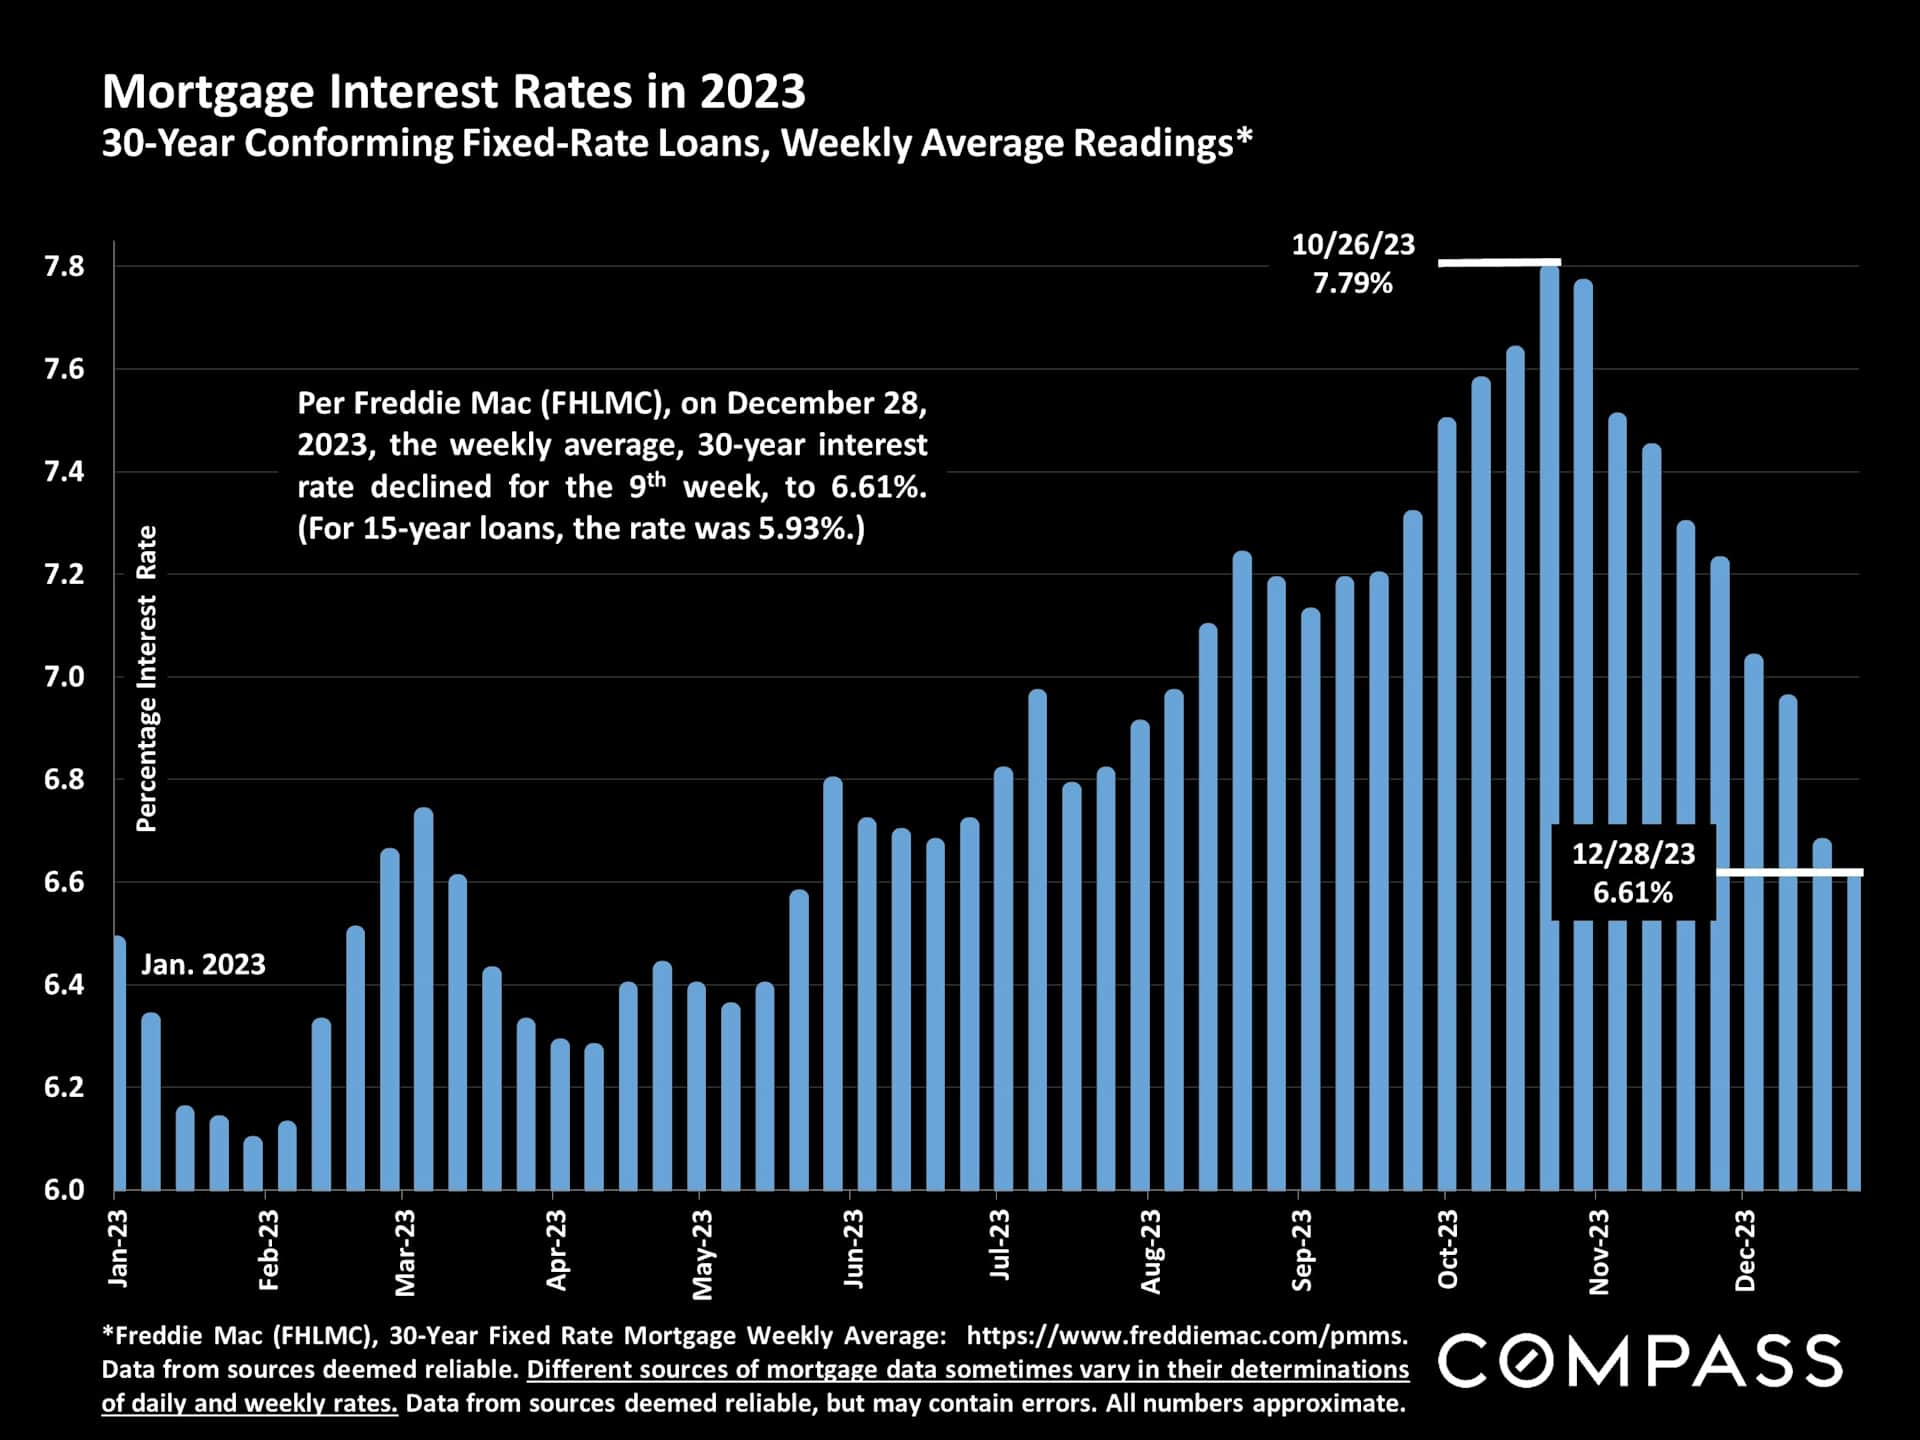
- In the last 2 months of 2023, the average, weekly, 30-year mortgage interest rate dropped from 7.79% to 6.61%.
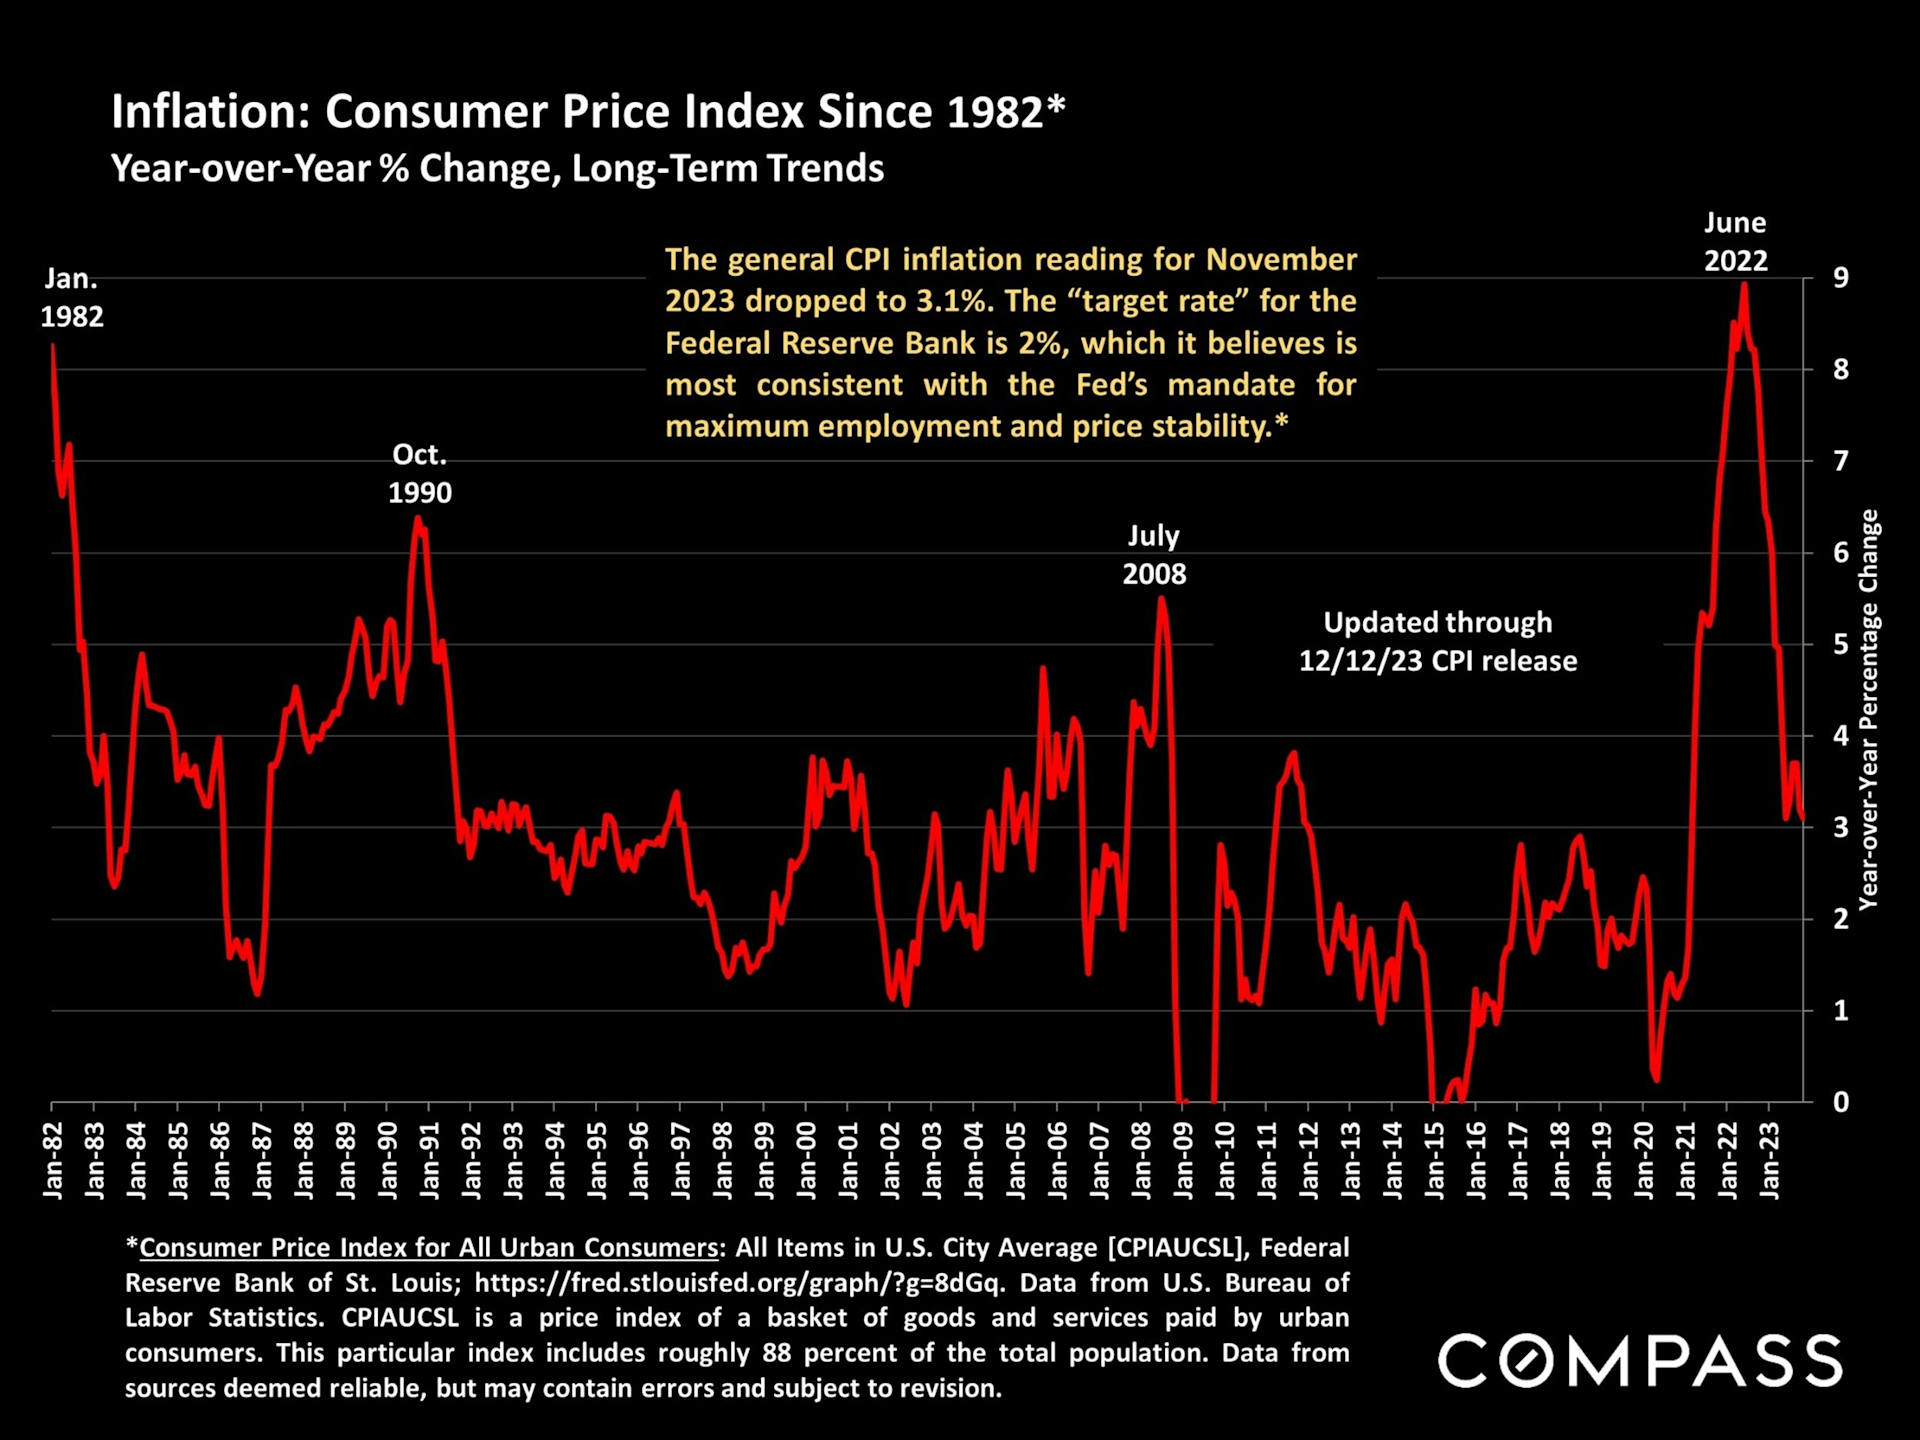
- CPI inflation declined in 2023 from 6.3% in January to 3.1% in November.
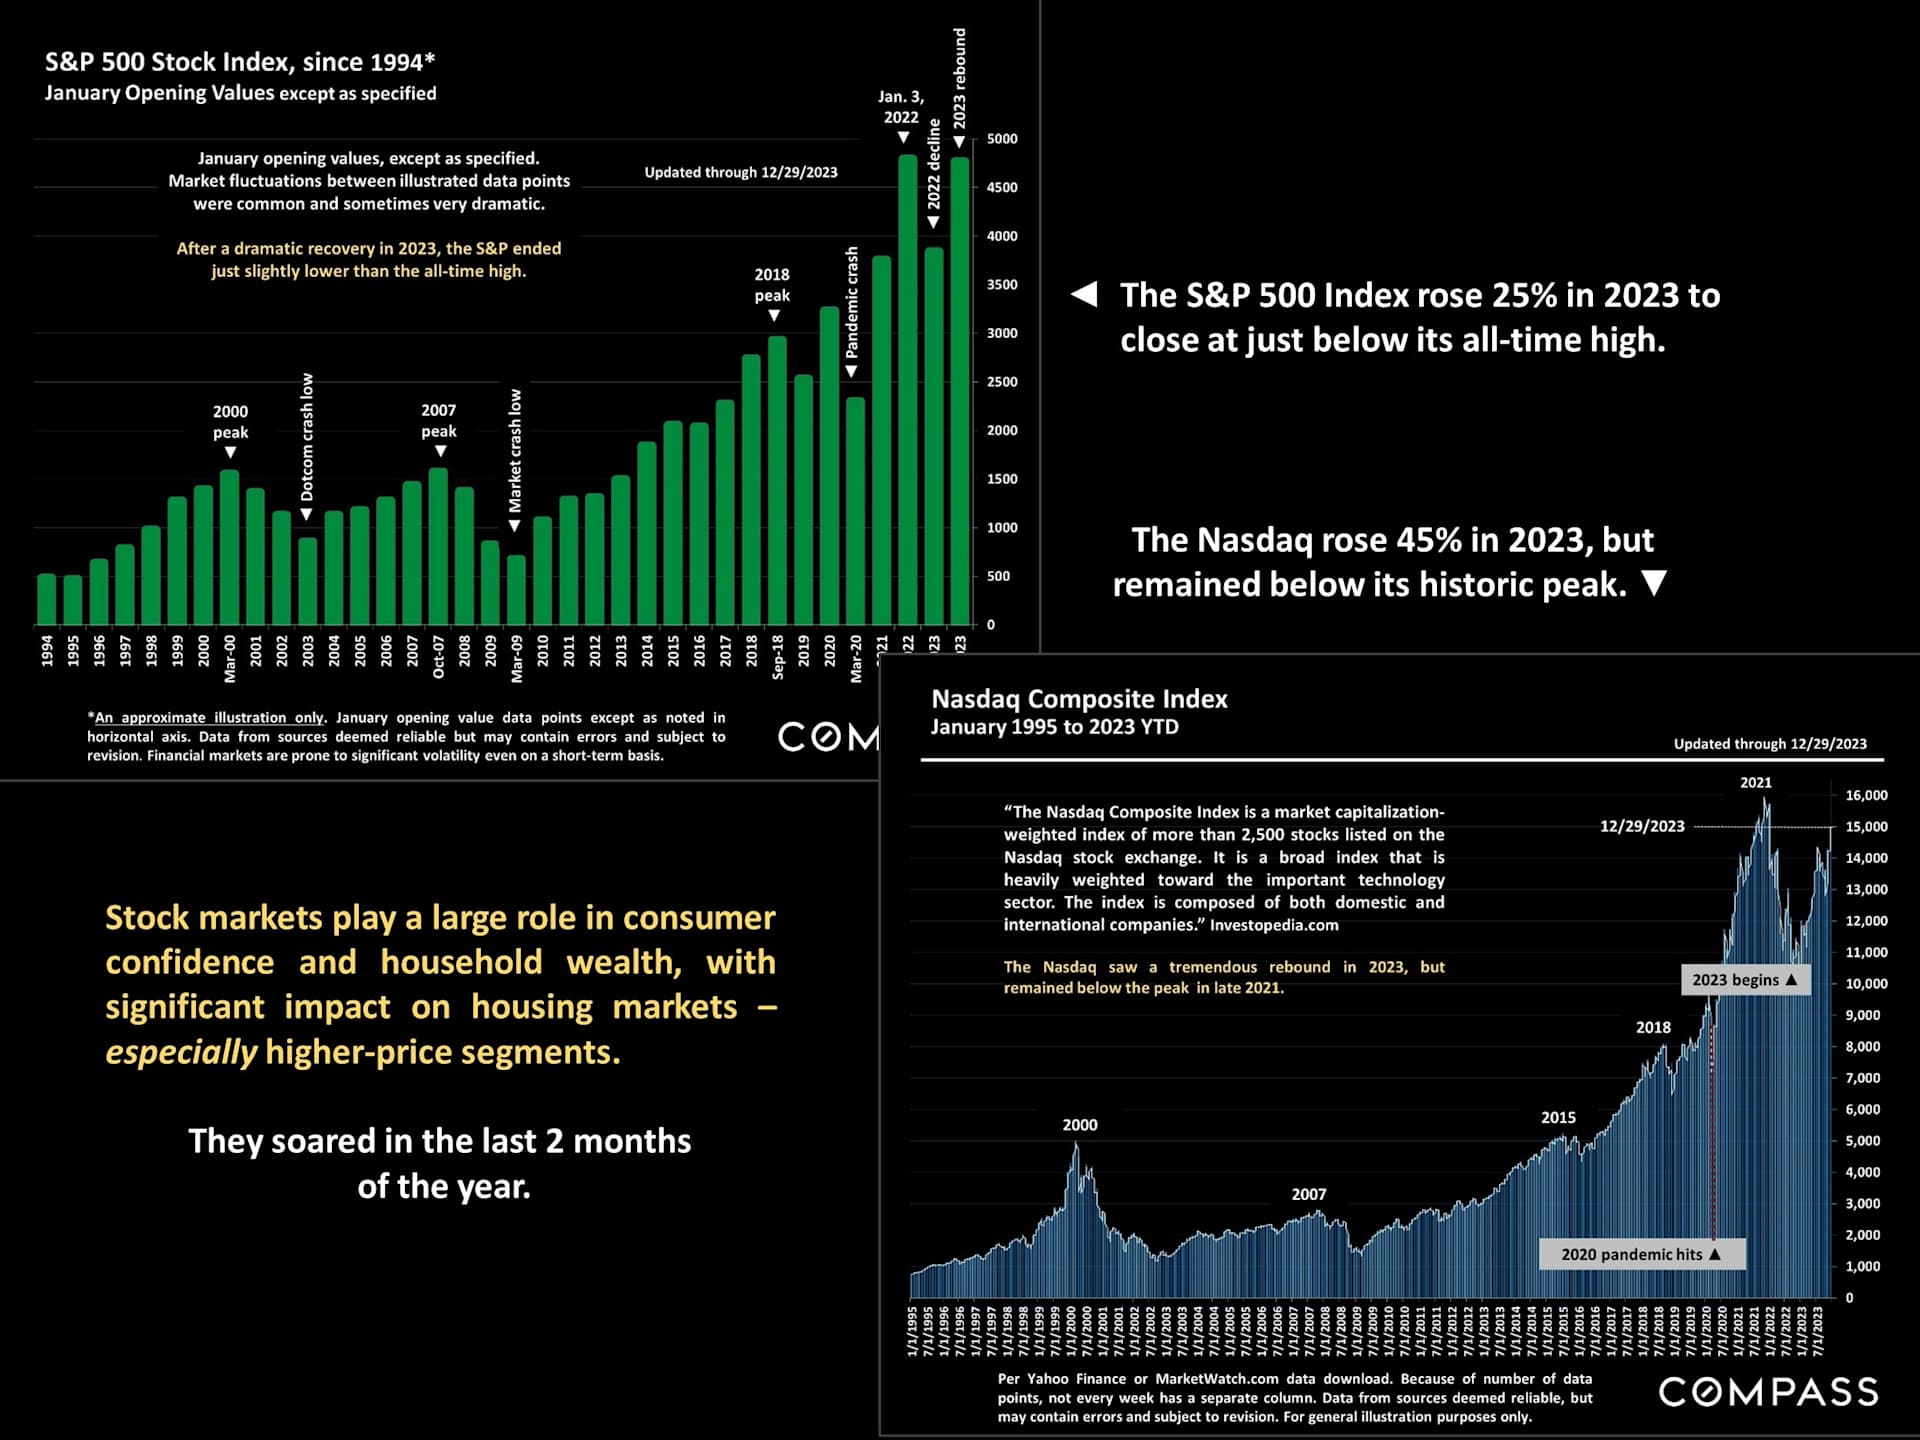
- After its end-of-year rally, the S&P Index was up 25% and the Nasdaq up 45% in 2023.
- According to the Case-Shiller Home Price Index, national home values hit a new peak in 2023.
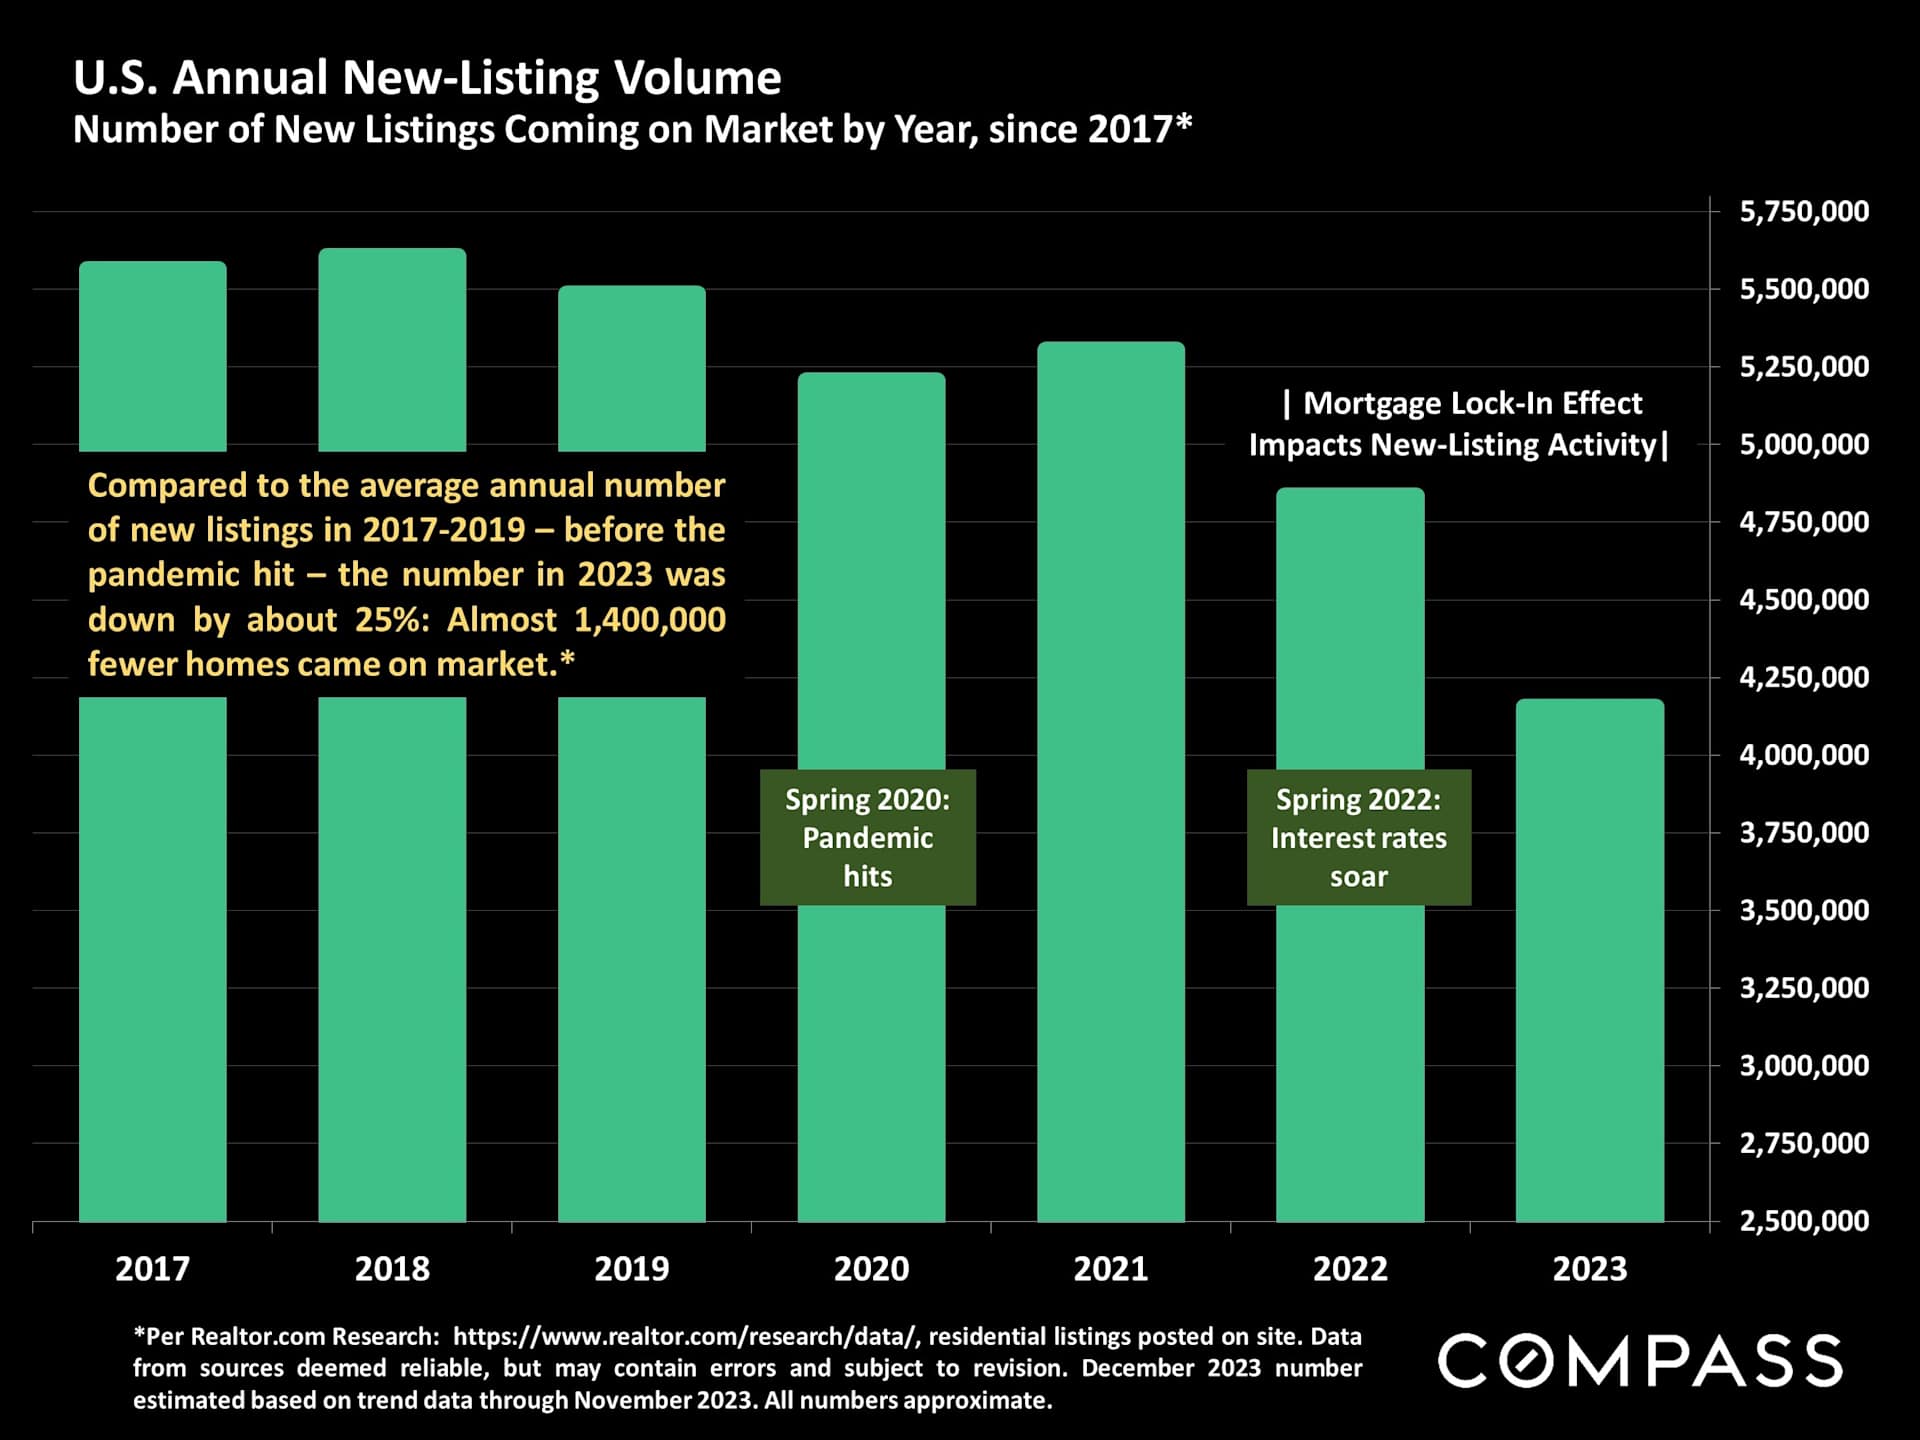
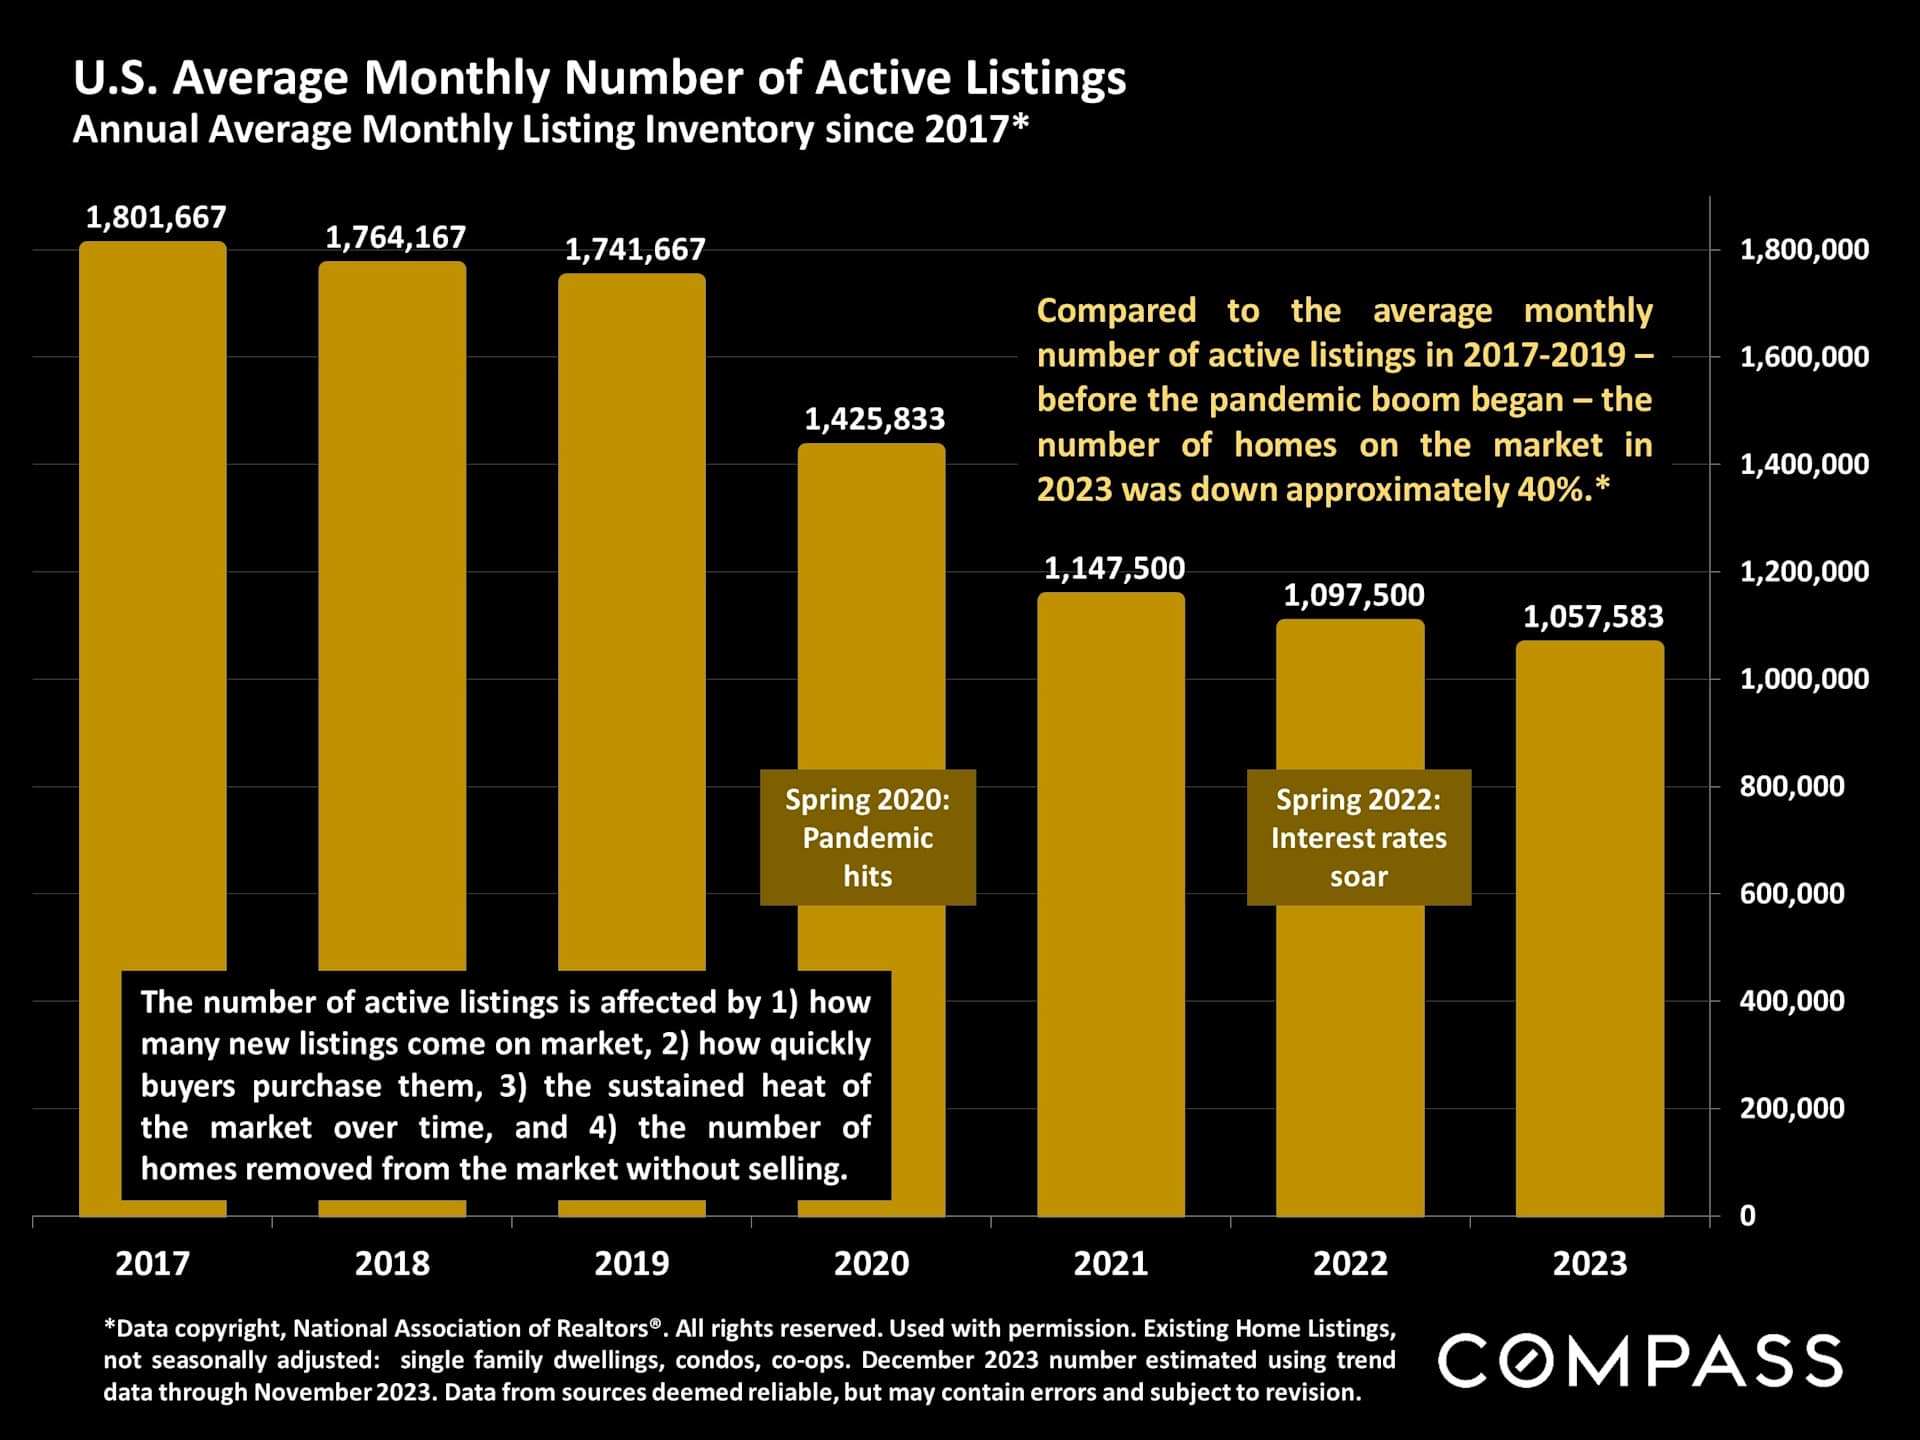
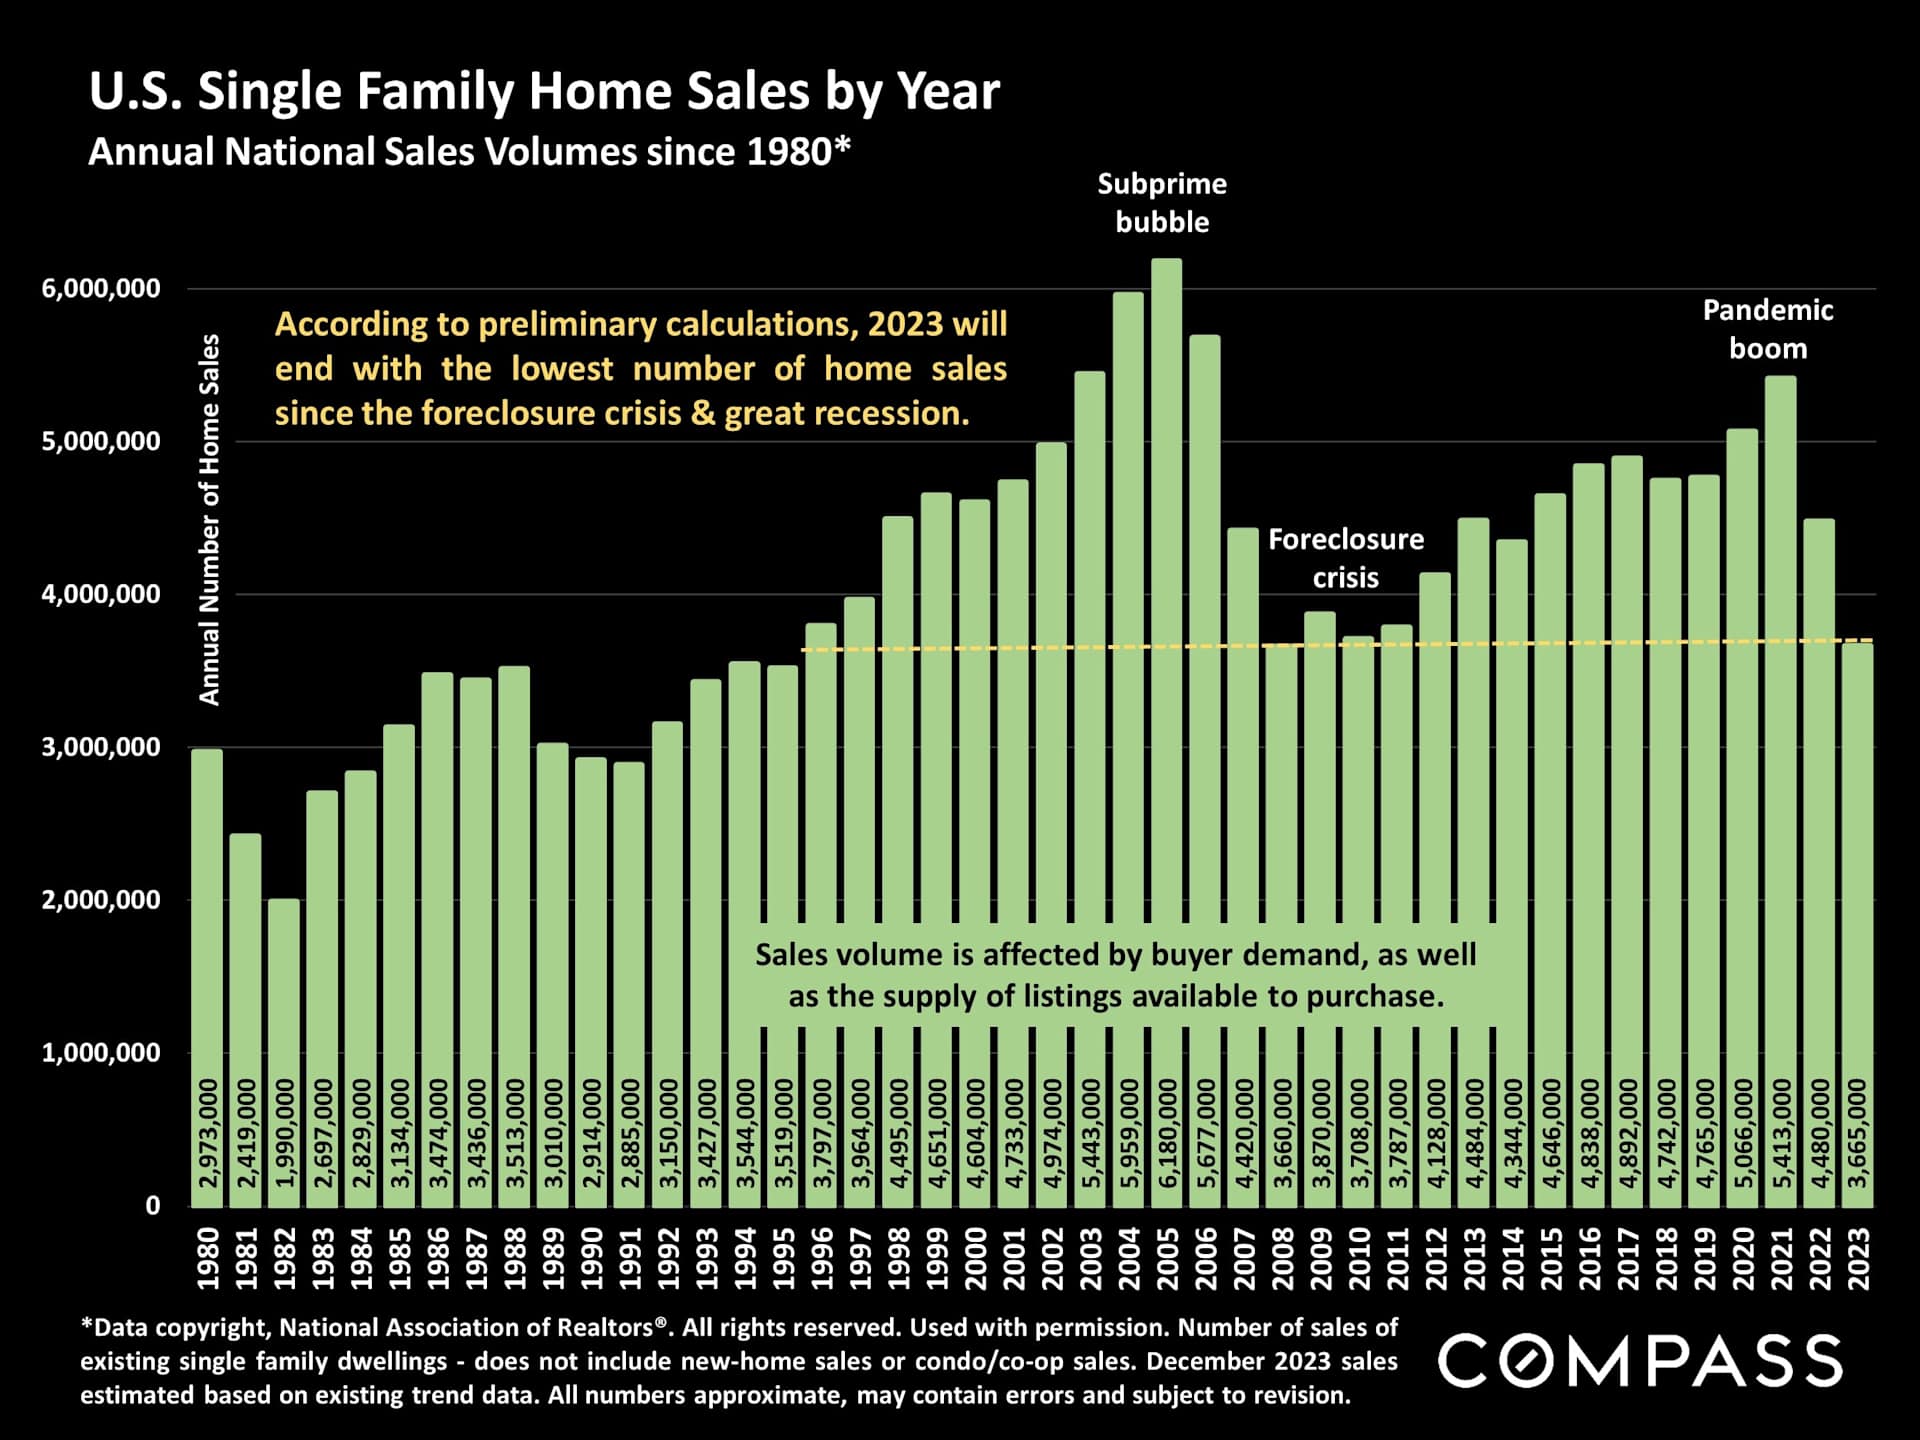
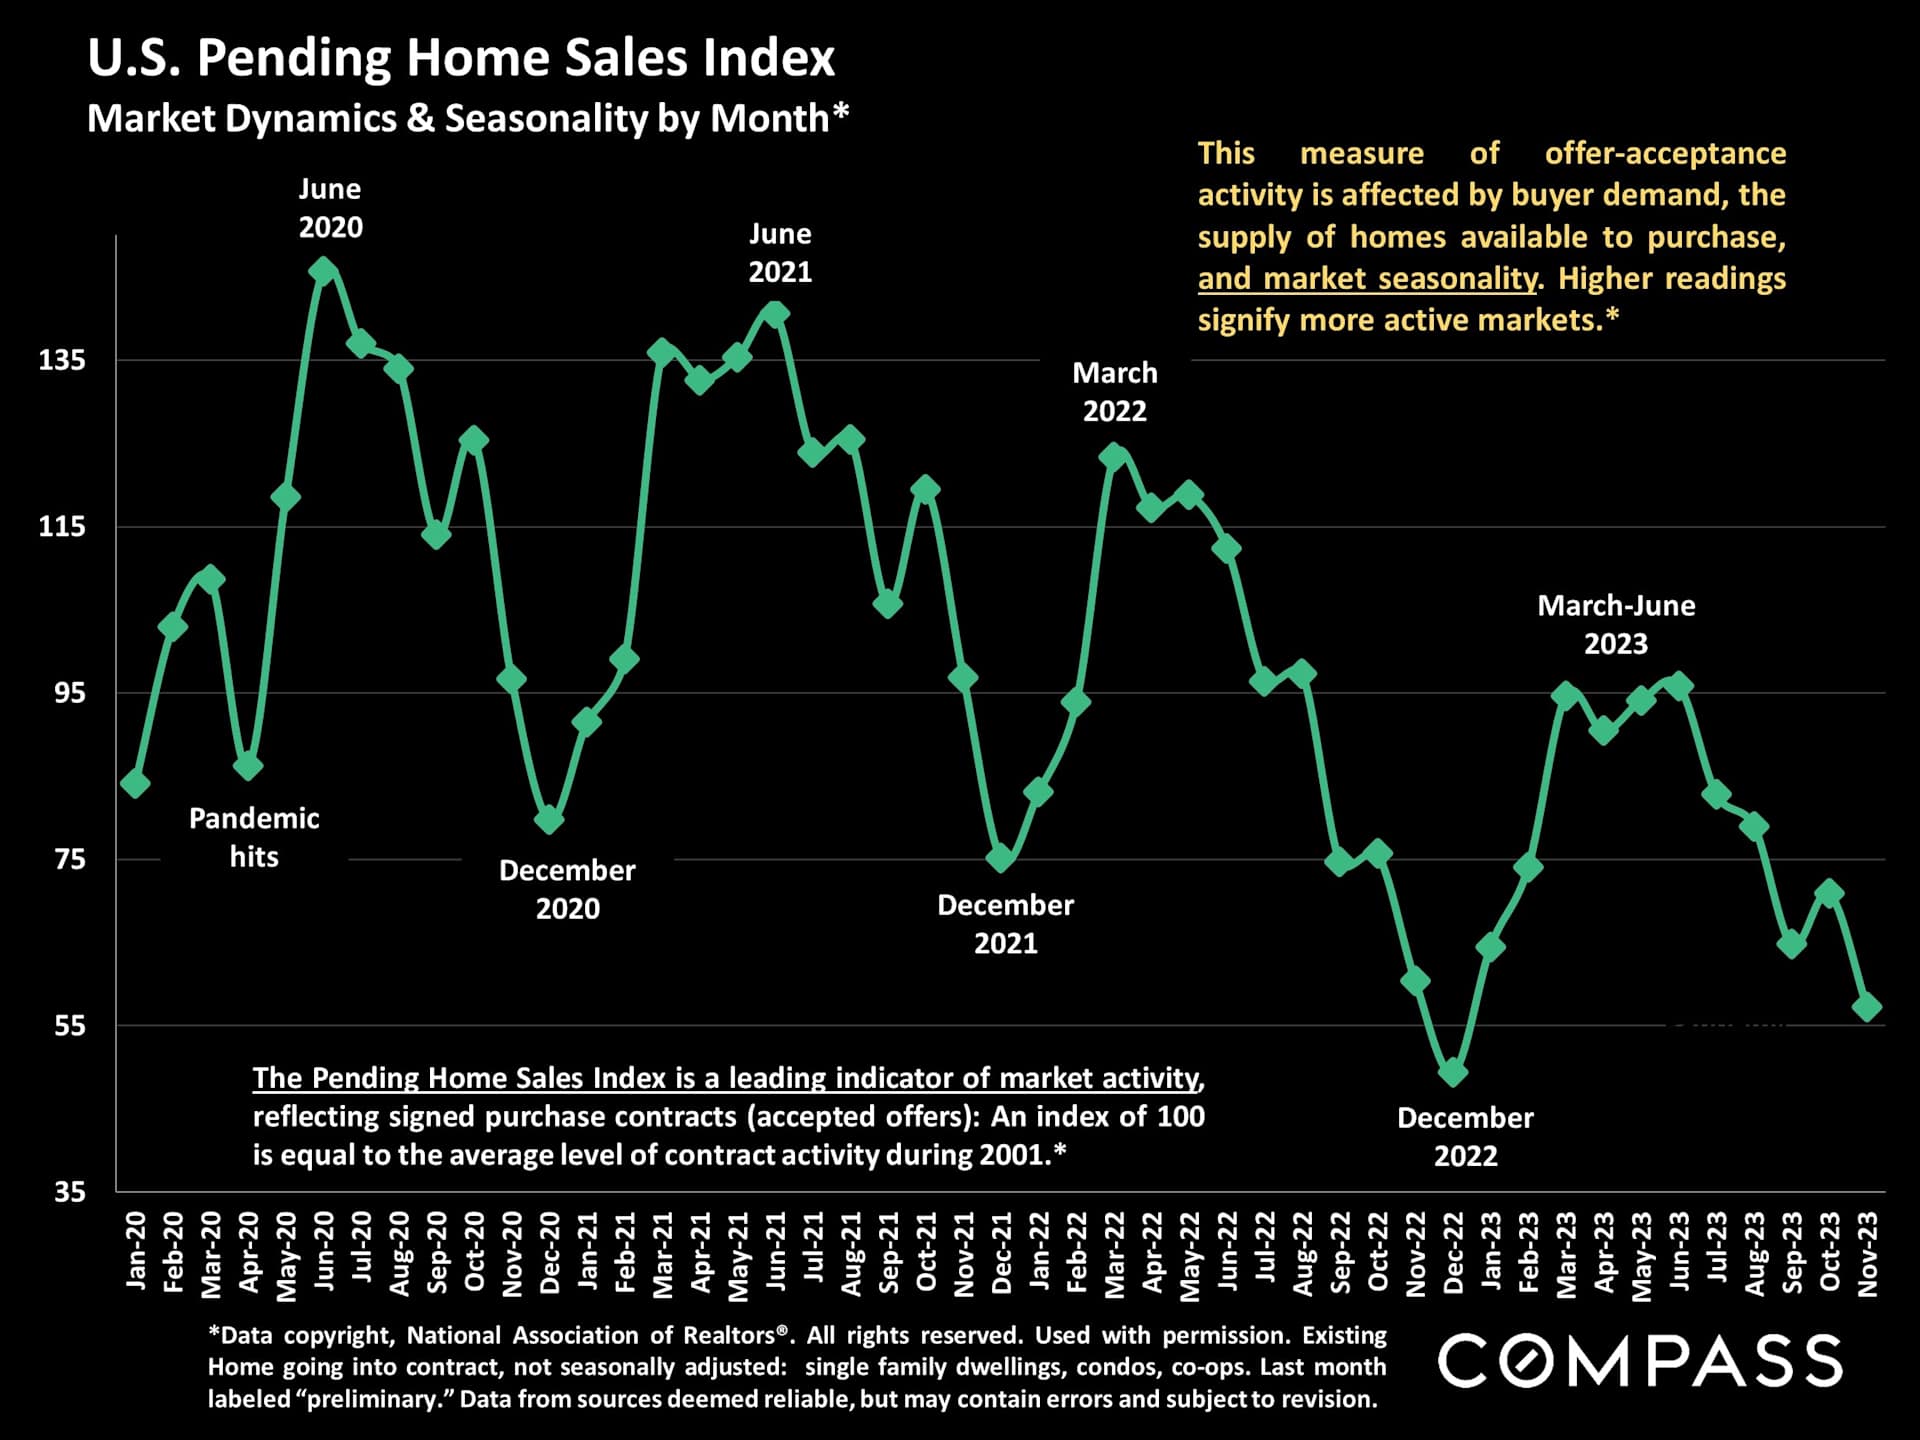
- The number of new listings coming on market in 2023 was the lowest in decades, a dominant factor behind sales dropping to their lowest annual total since the great recession.
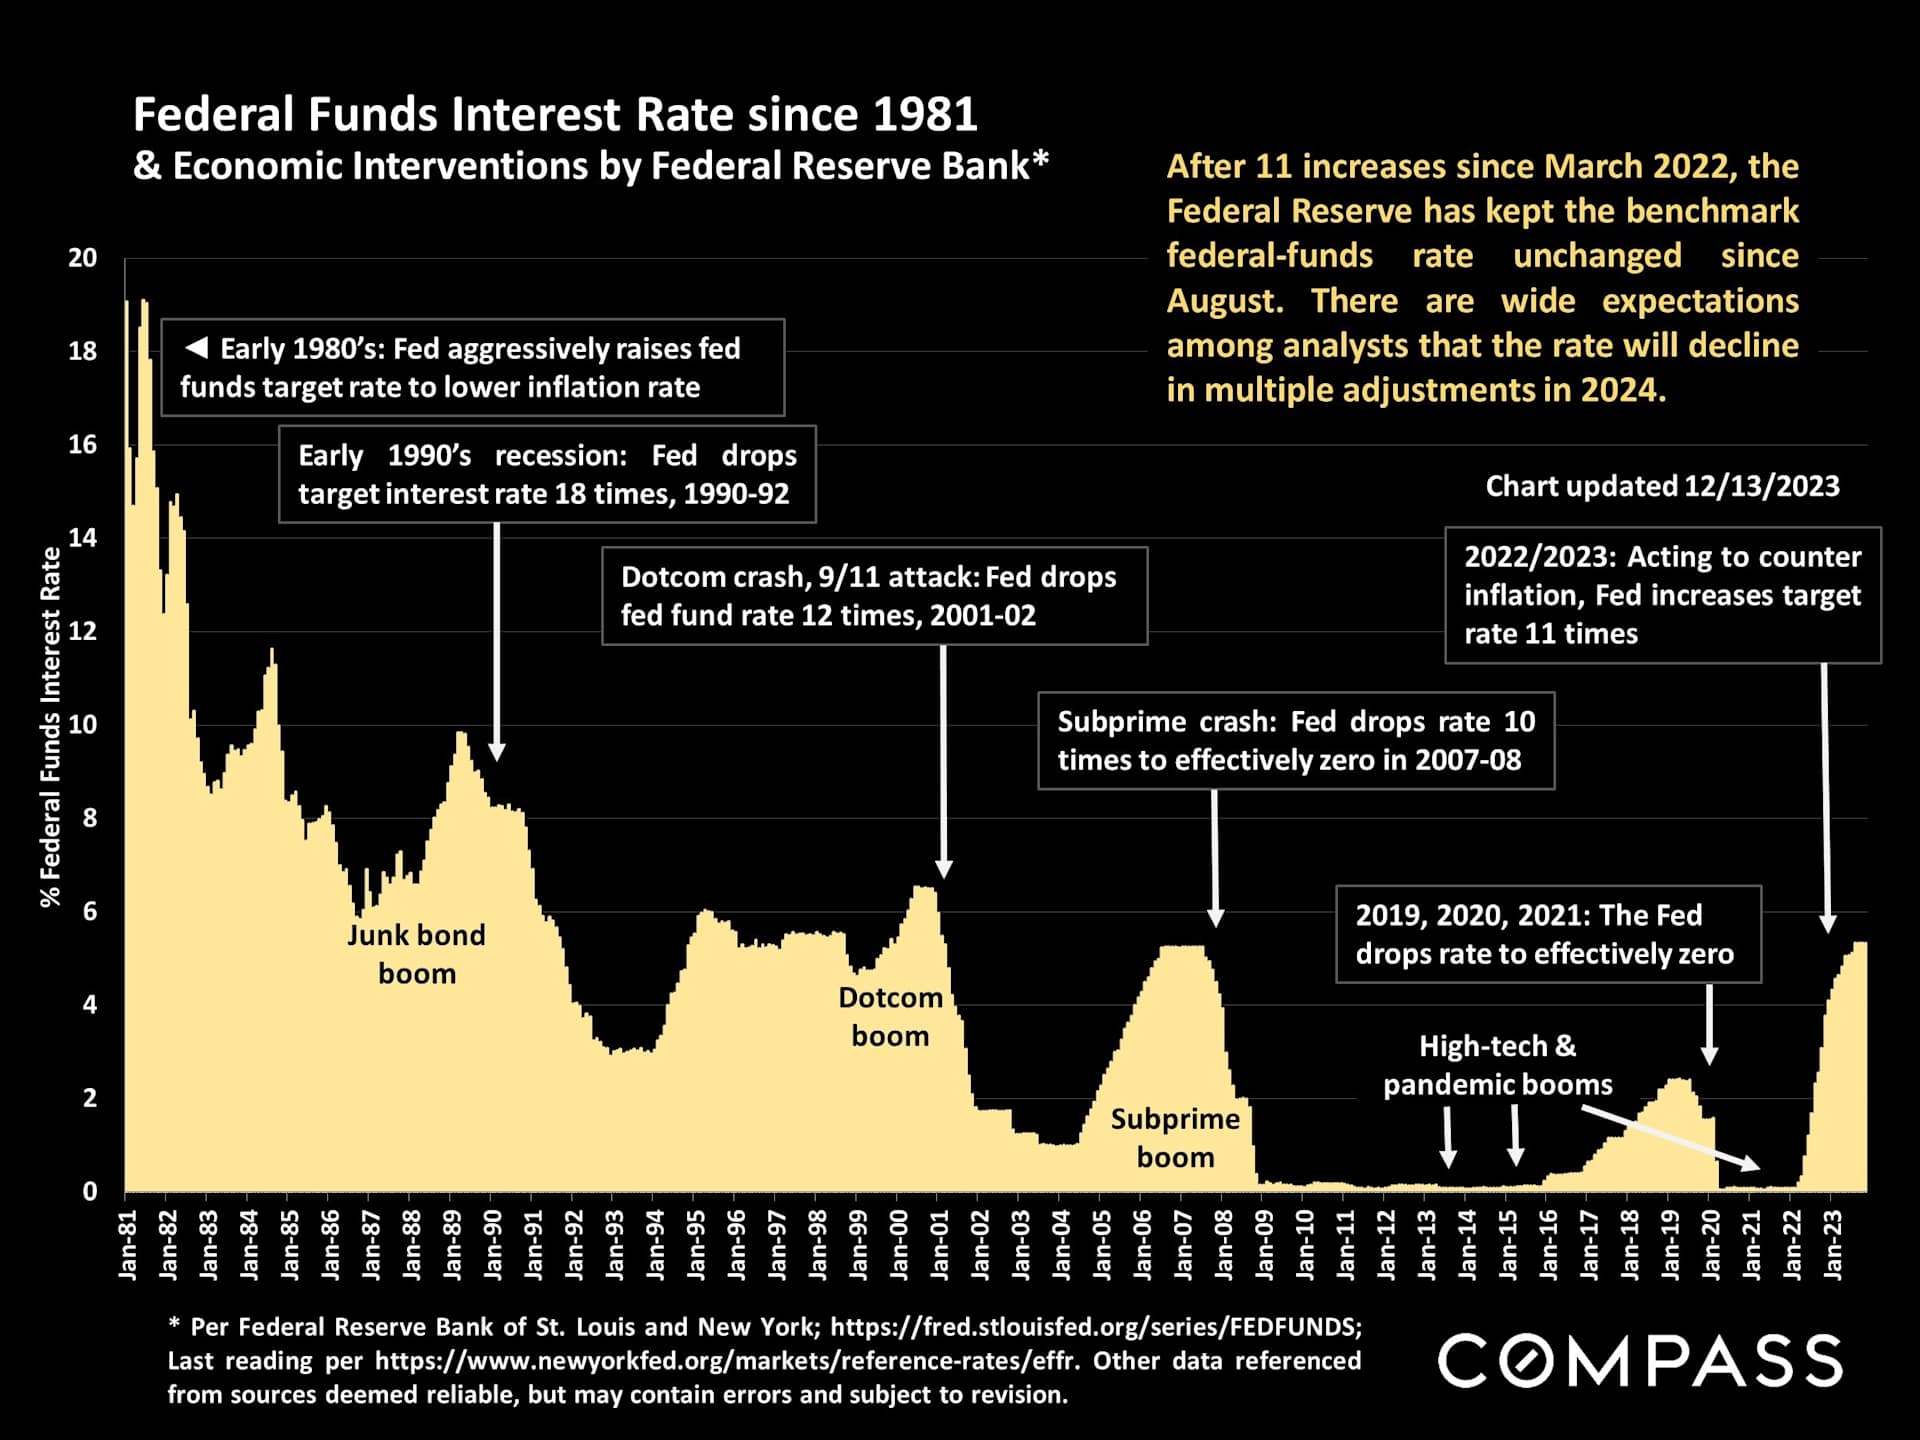
The 2023 market was characterized by high interest rates, financial market uncertainty, surprisingly strong demand (considering first two issues), and an extremely low supply of new listings which maintained upward pressure on prices, even as housing affordability dropped. Purchase activity was repressed due to interest rates and the inadequate supply of homes for sale, while for prospective sellers, the motivation to move was reduced by the mortgage lock-in effect. With interest rates falling and economic conditions rebounding - which should further boost buyer demand in 2024 the big question is how much do rates have to fall for homeowners to start selling their homes in normal numbers again?
A national report is a huge generalization of conditions and trends across thousands of different markets. In this report, December 2023 numbers were sometimes estimated based on trend-data through November: Final adjustments are not expected to be significant. As often seen in recent years, factors affecting economic and housing market conditions can be volatile and hard to predict.