Recent reports from The Wall Street Journal (09/8/23) indicate that the housing market's swift recovery has caught many by surprise. Despite concerns over rising mortgage rates last year, the residential real estate downturn is proving to be shorter and less severe than anticipated by housing experts. However, there's still a significant shortage of available homes to meet the strong demand from buyers.
According to Realtor.com Chief Economist, in line with historical trends related to inventory and pricing, the autumn season typically brings about more favorable conditions for homebuyers compared to the rest of the year. This offers a glimmer of hope for those navigating today's challenging housing market.
In August 2023, the median sales price for single-family homes witnessed a notable 3.7% increase compared to the previous year. A striking 31% of homes were sold above their asking price, with 27% of buyers opting for all-cash transactions. NAR Chief Economist Lawrence Yun remarked, "Home sales have remained stable for several months, showing neither significant increases nor declines. Short-term fluctuations will depend on mortgage rate changes, while long-term trends will be influenced by job gains."
The autumn selling season officially kicked off after Labor Day and is expected to extend until early to mid-November. This period, though relatively brief, is traditionally the second busiest in the housing market, right after the spring season, in many regions across the country.
In this report, we will delve into national trends concerning home prices, listing supply, and buyer demand. Additionally, we will consider various economic and demographic indicators. However, it's essential to keep in mind that national data provides a broad overview and doesn't capture the nuances of regional submarkets, each of which has its unique values and market dynamics. Stay tuned for the release of September sales data, expected in the third week of October, to gain further insights into the evolving real estate landscape.
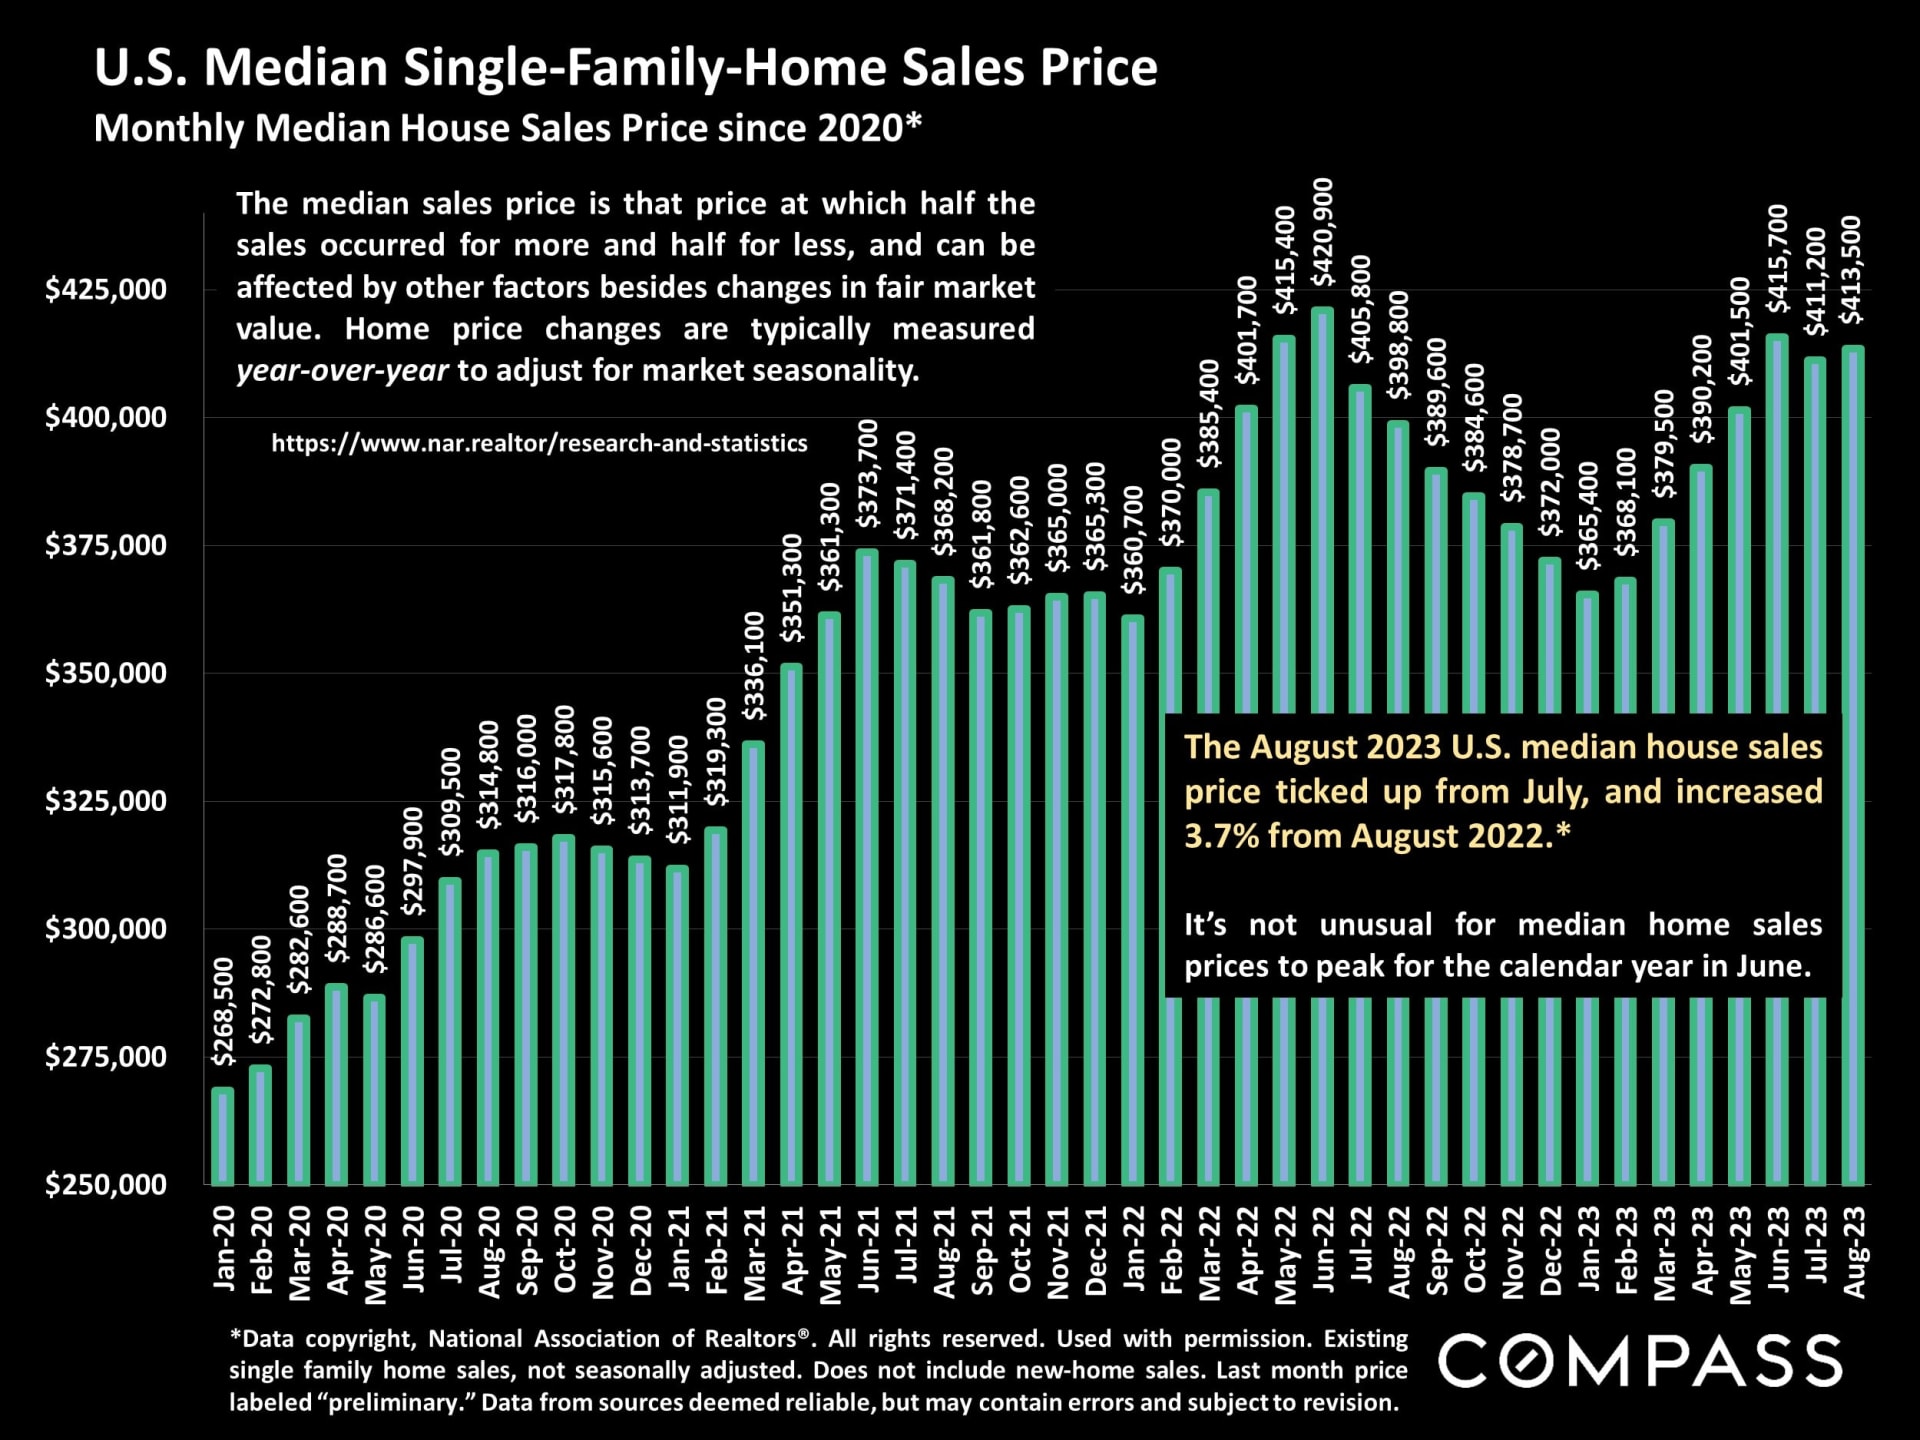
Monthly median house sales price since 2020: The August 2023 median price increased slightly from July, and was up 3.7% year-over-year.
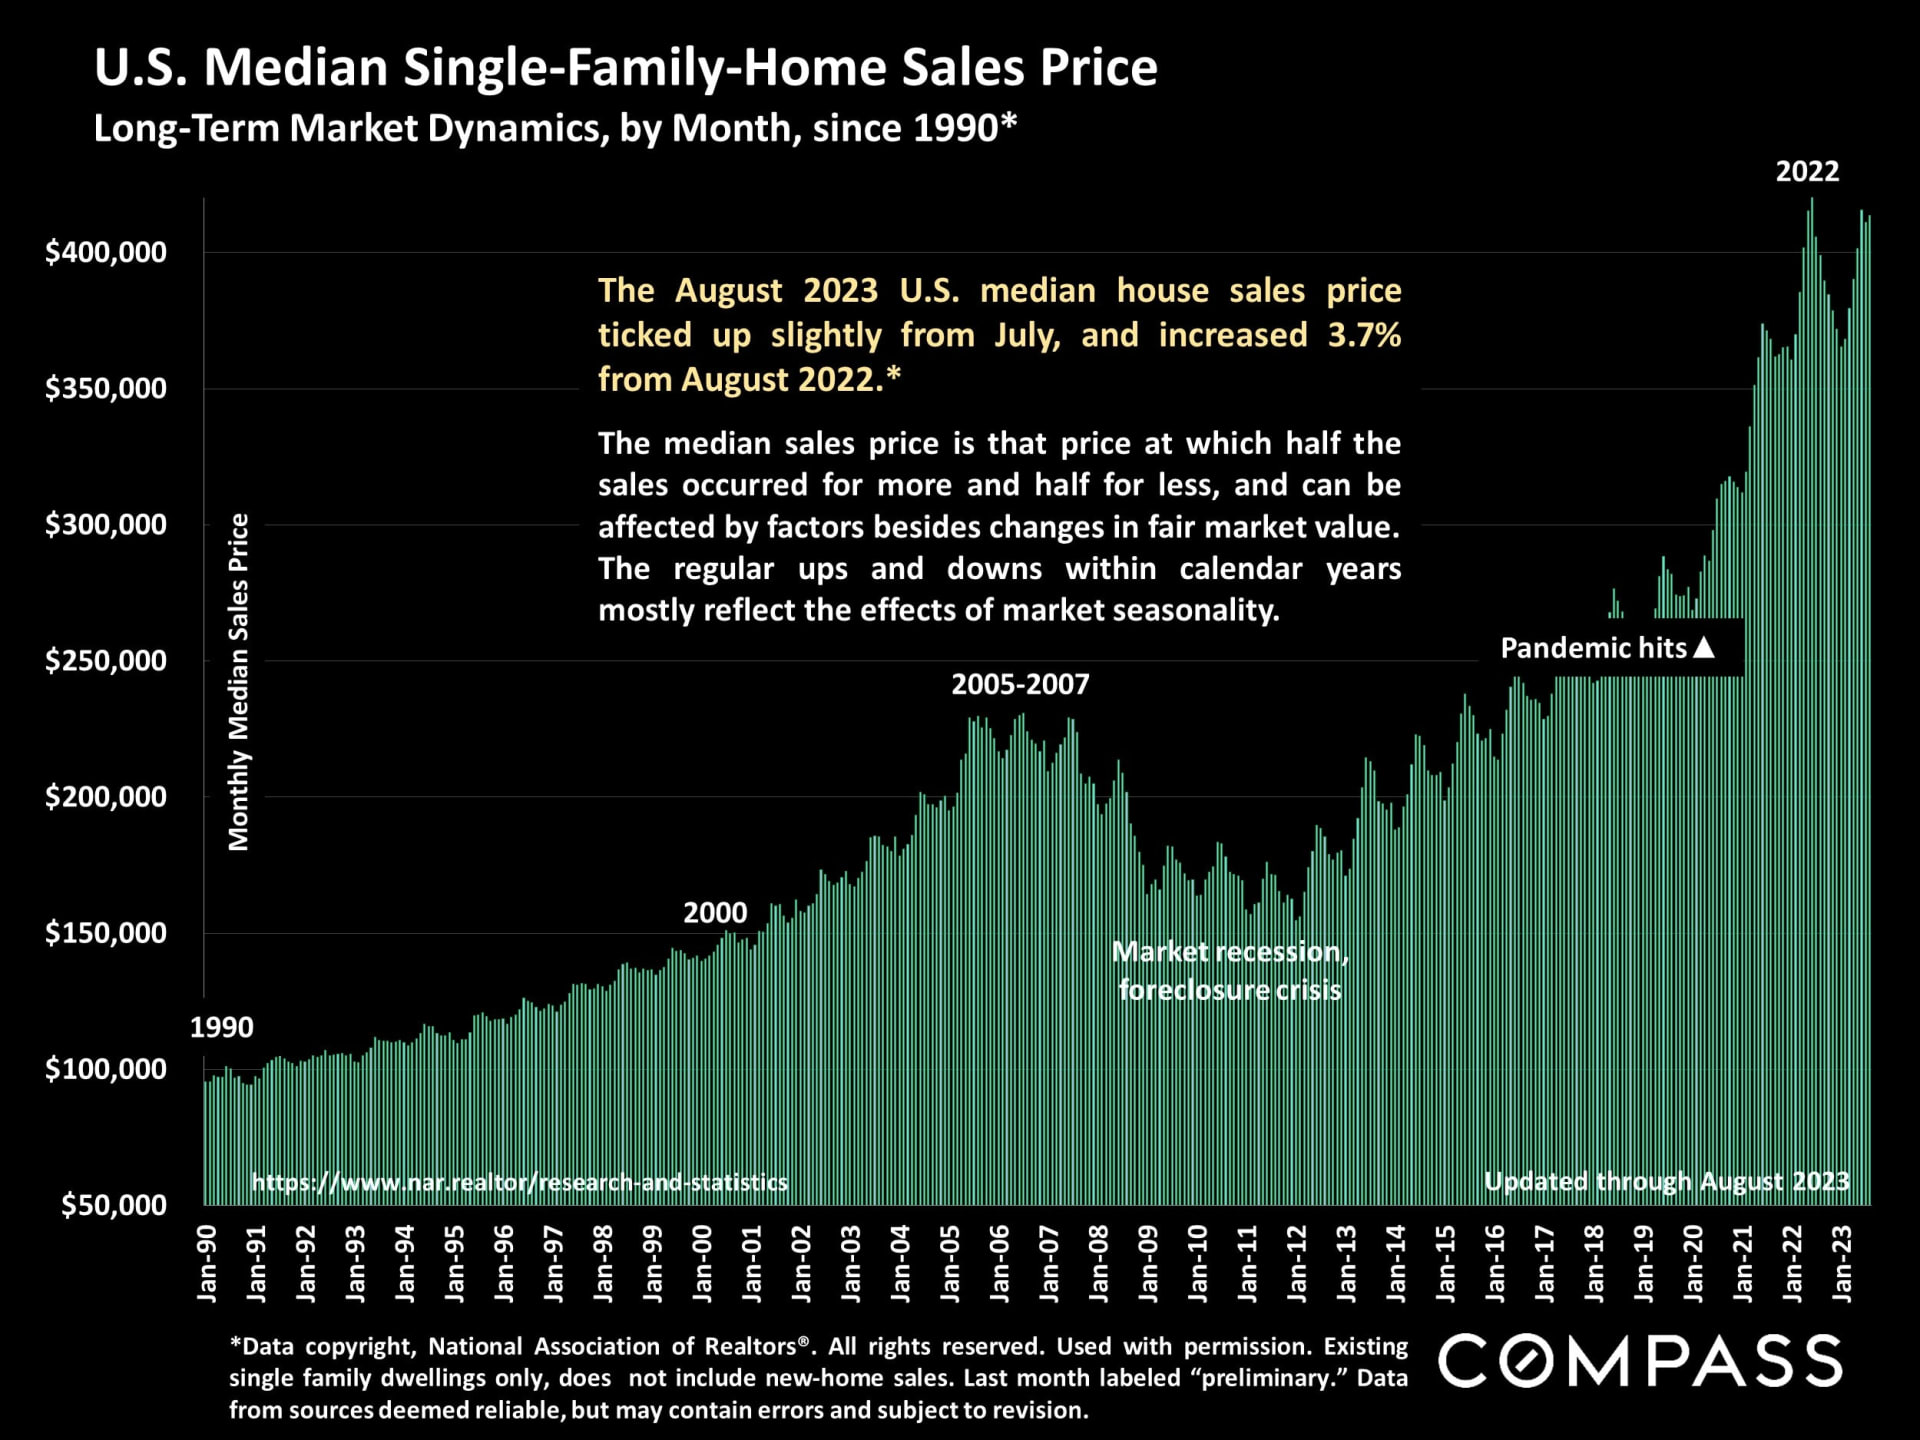
Median home sales prices since 1990. After dropping in late 2022, prices have rebounded in 2023 close to their historic peak in June 2022.
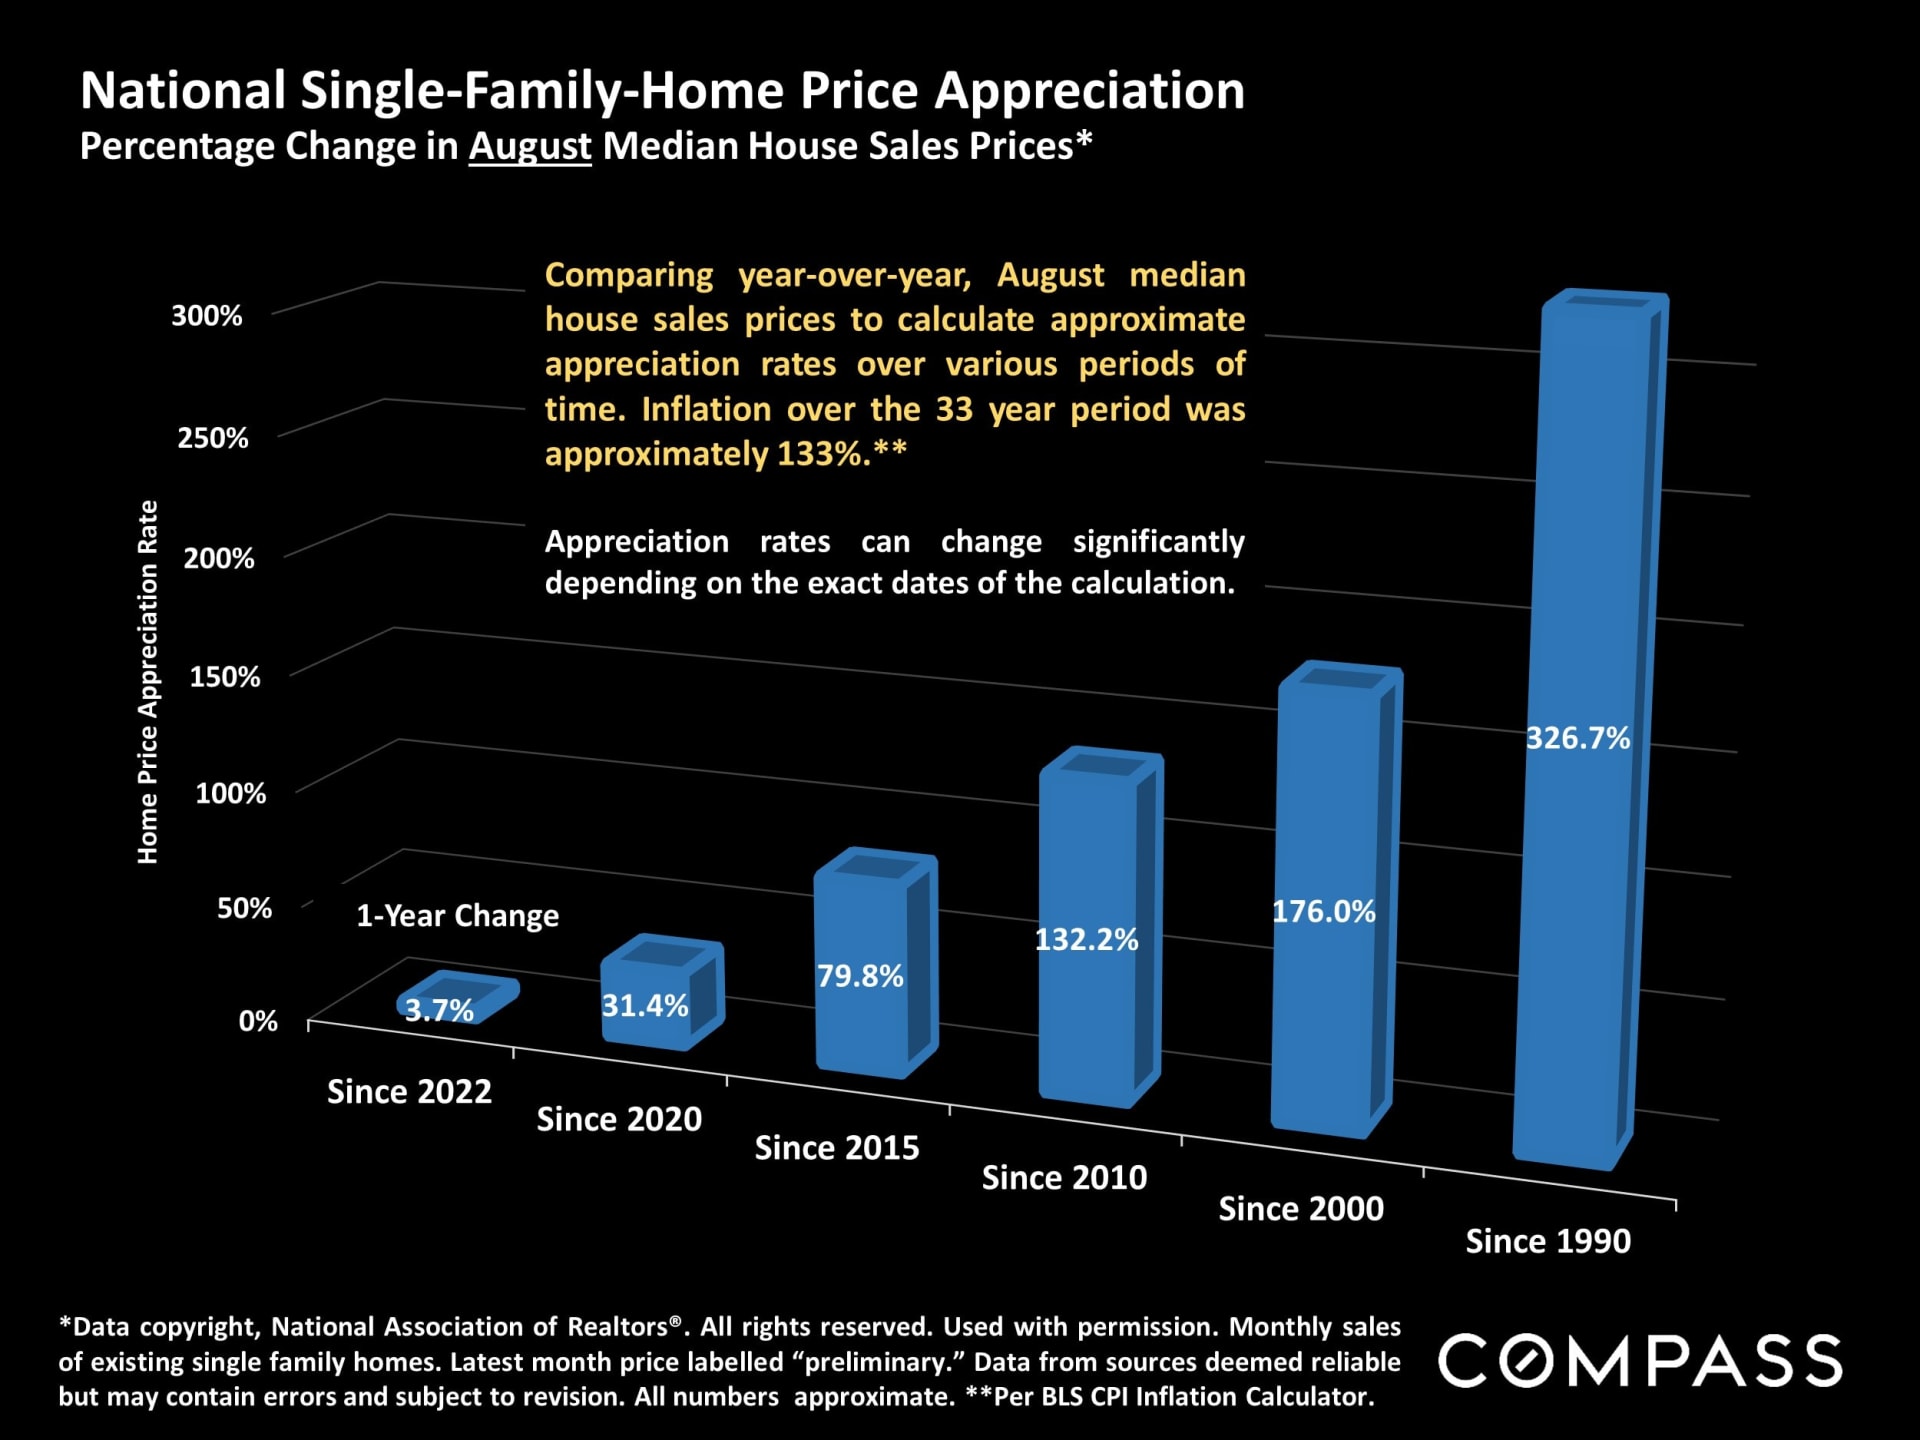
U.S. median house sales price appreciation over varying periods since 1990.
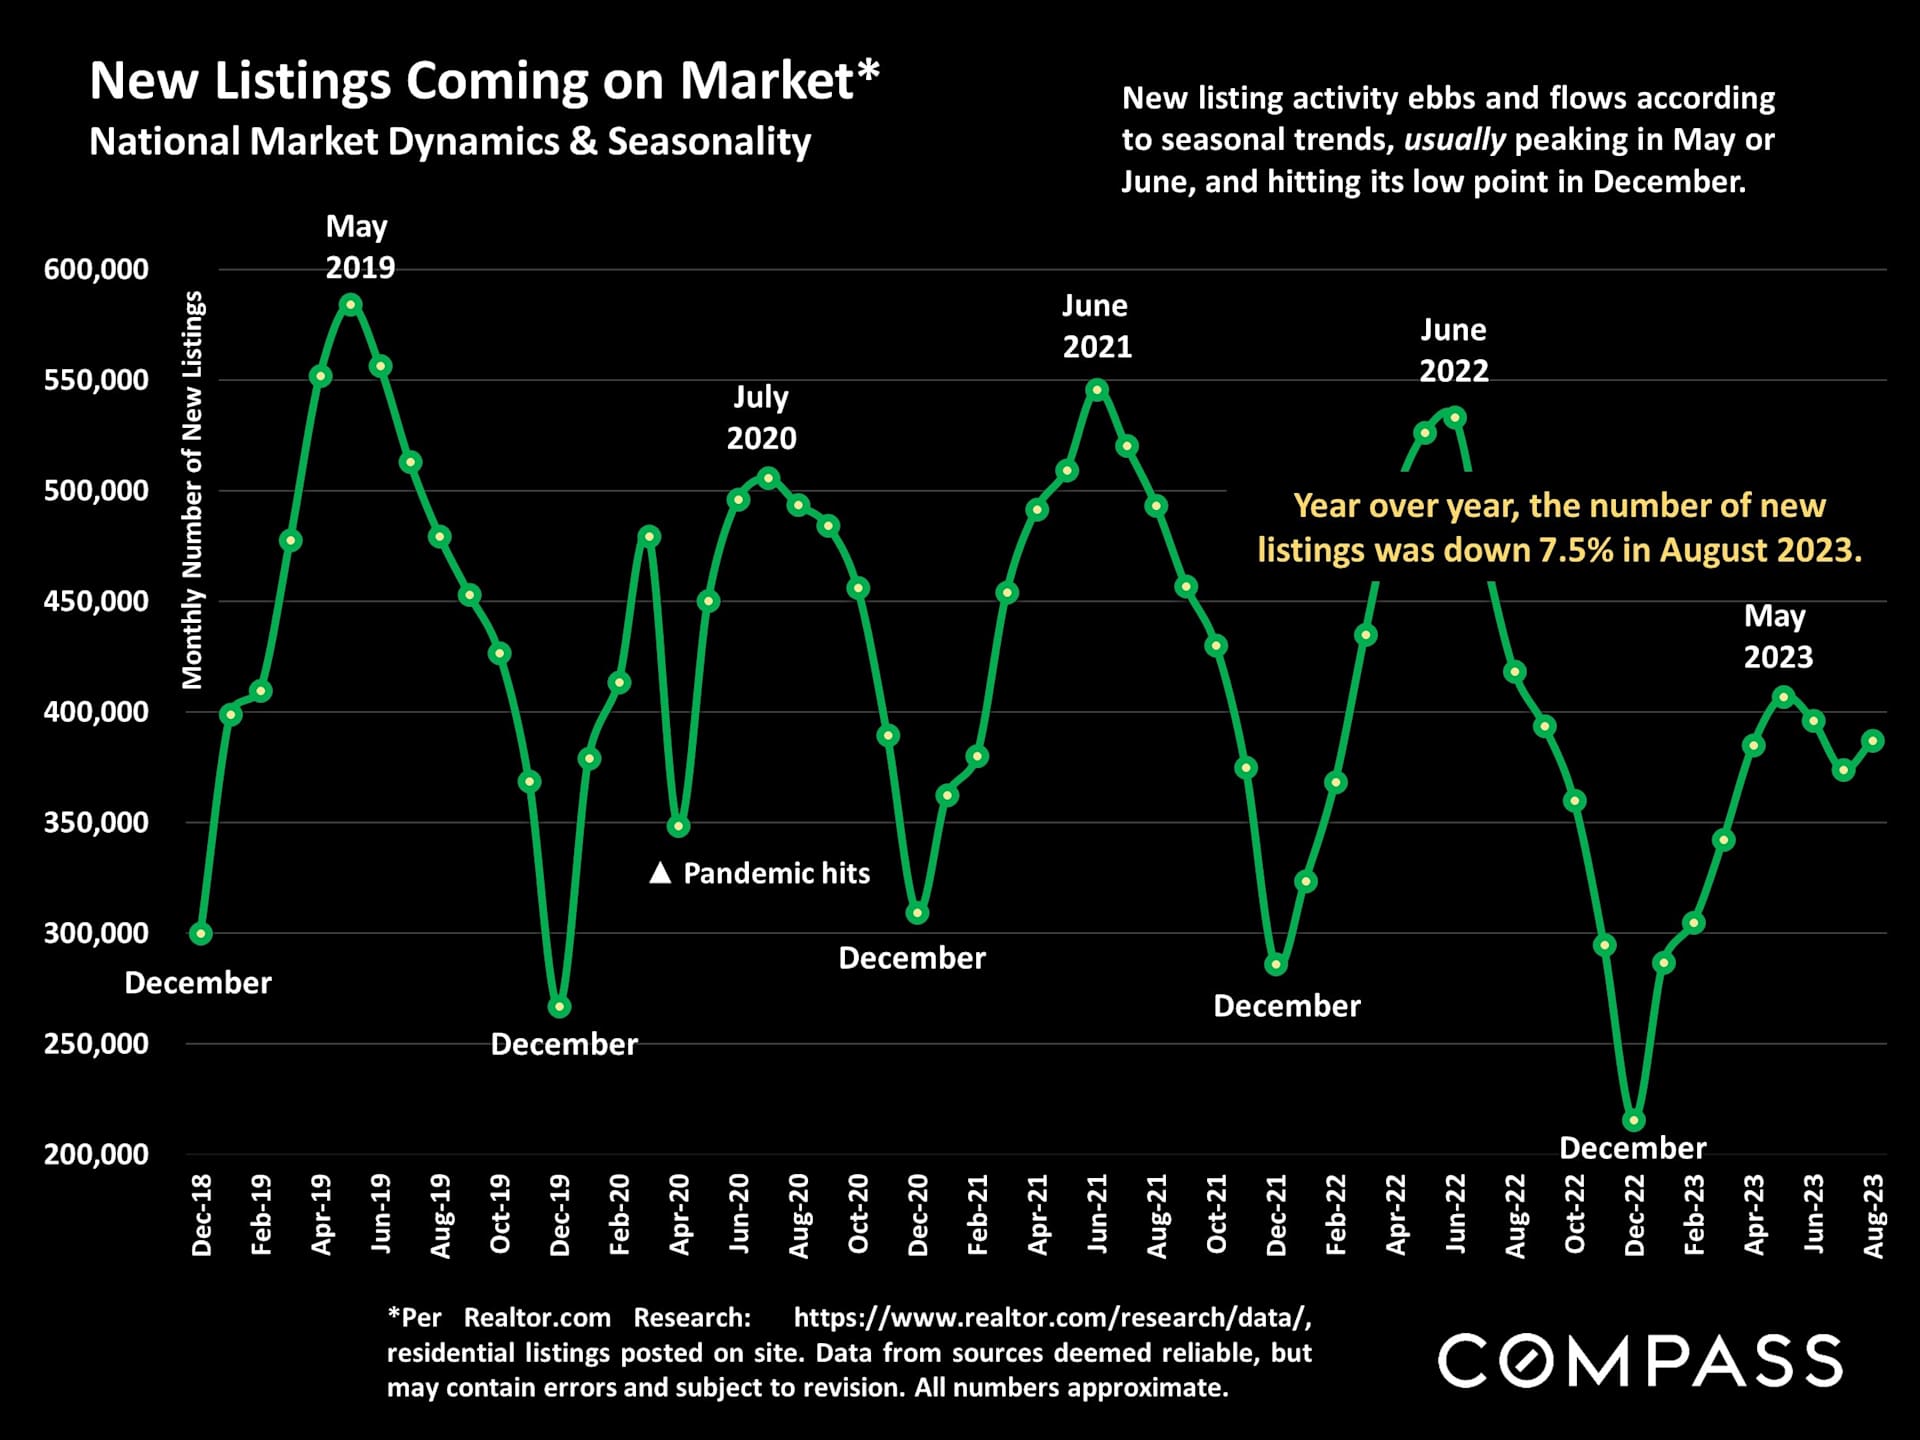
The number of new listings in August 2023 dropped 7.5% year-over-year. Over the past 12 months, almost a million fewer new listings came on the market.
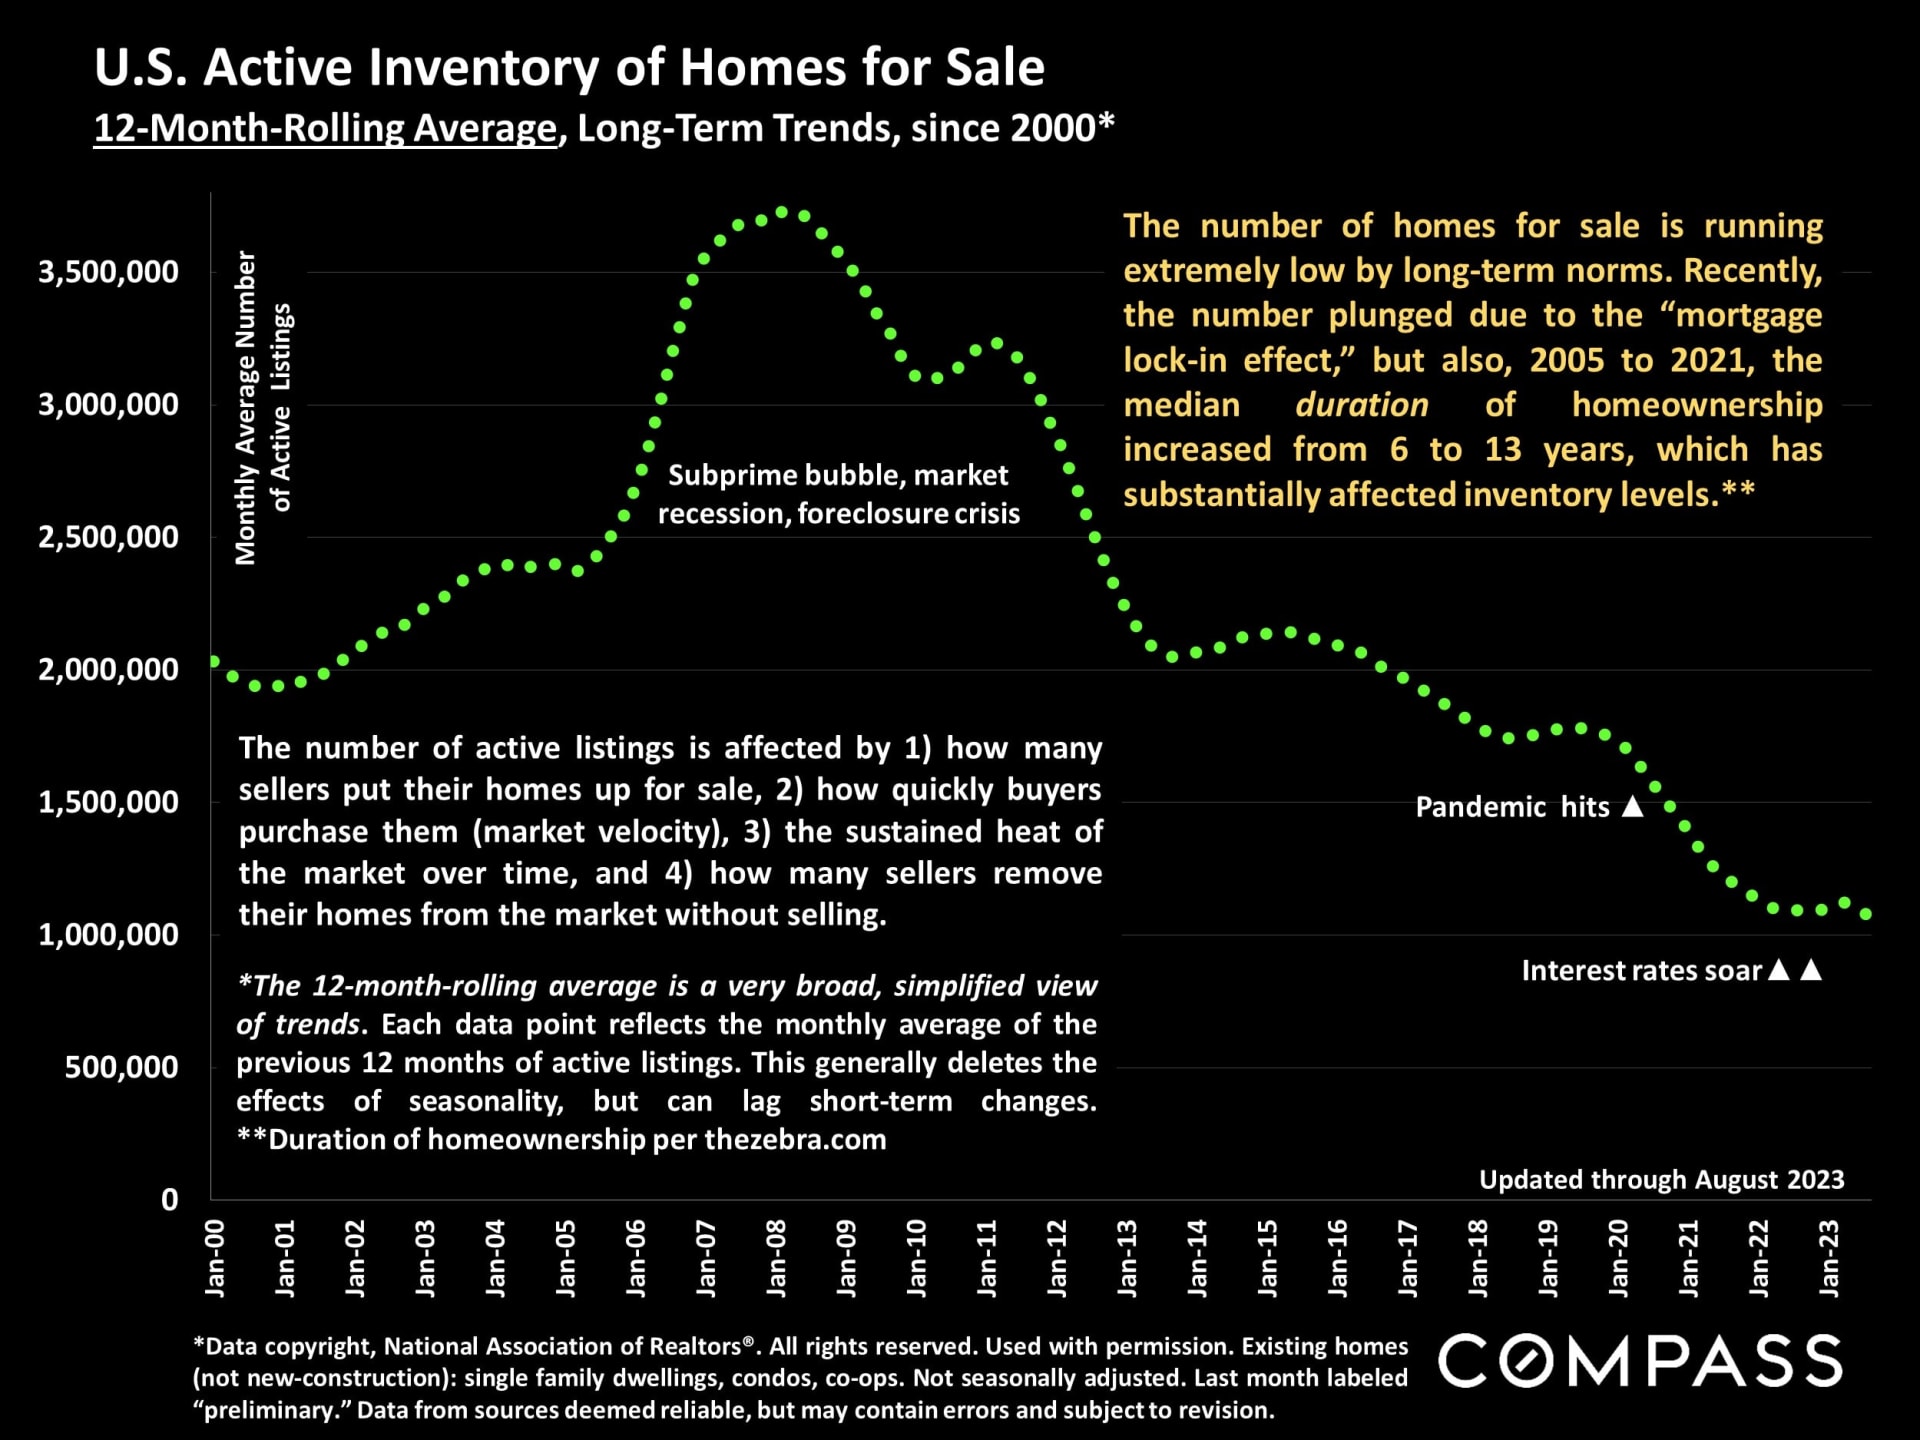
Long-term trends in the number of homes for sale: This 12-month-rolling-average chart illustrates the enormous changes in inventory since 2000 and since 2020.
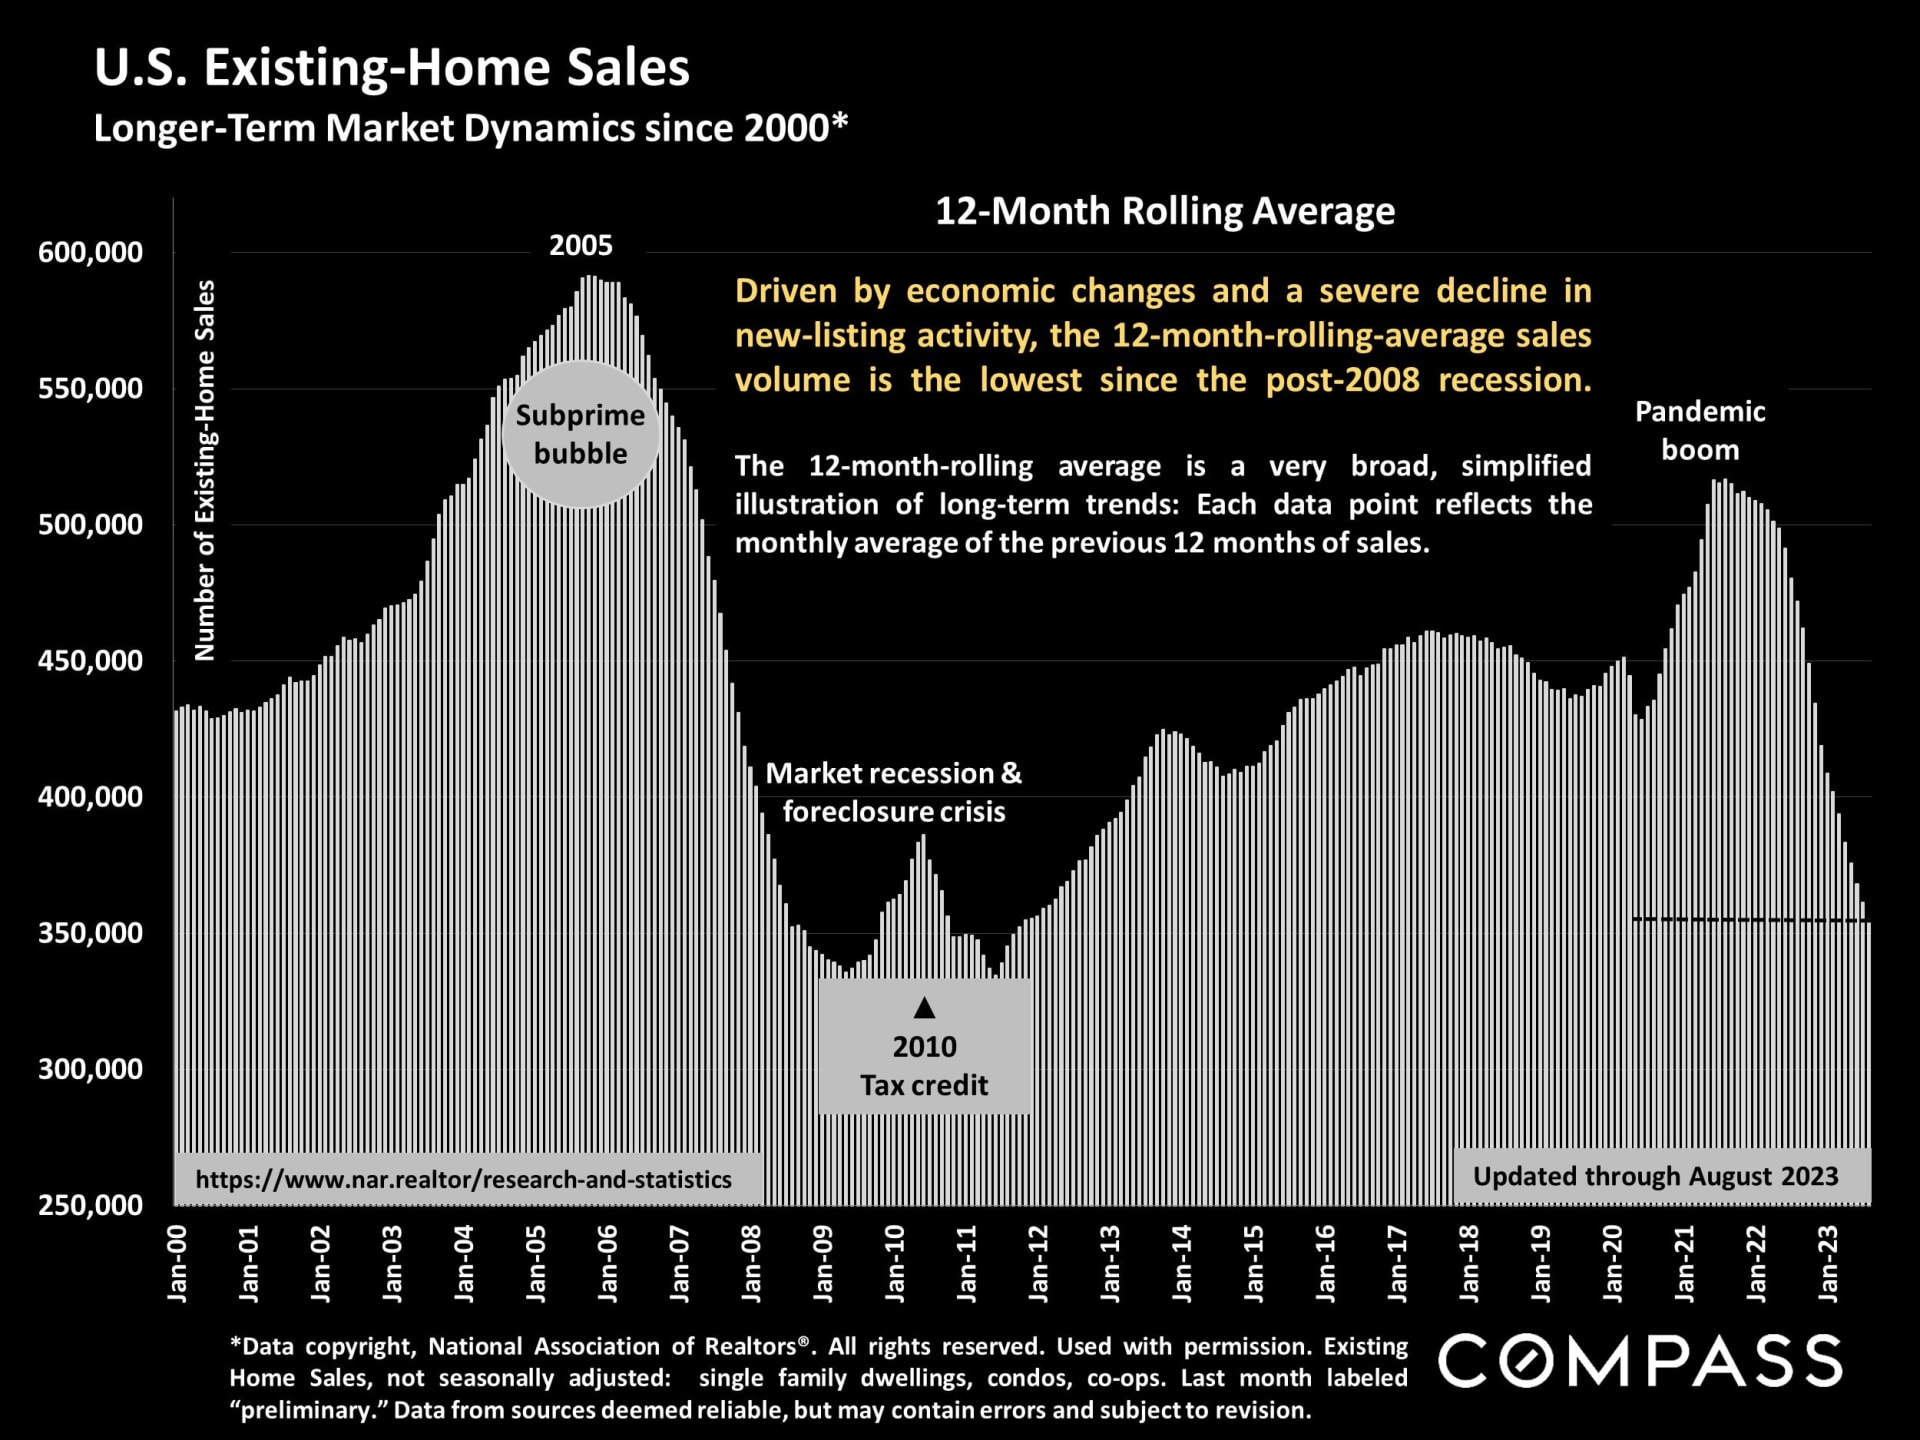
Long-term trends in sales: On a 12-month-rolling-average basis, sales volume - after surging during the pandemic boom - is the lowest since the great recession.
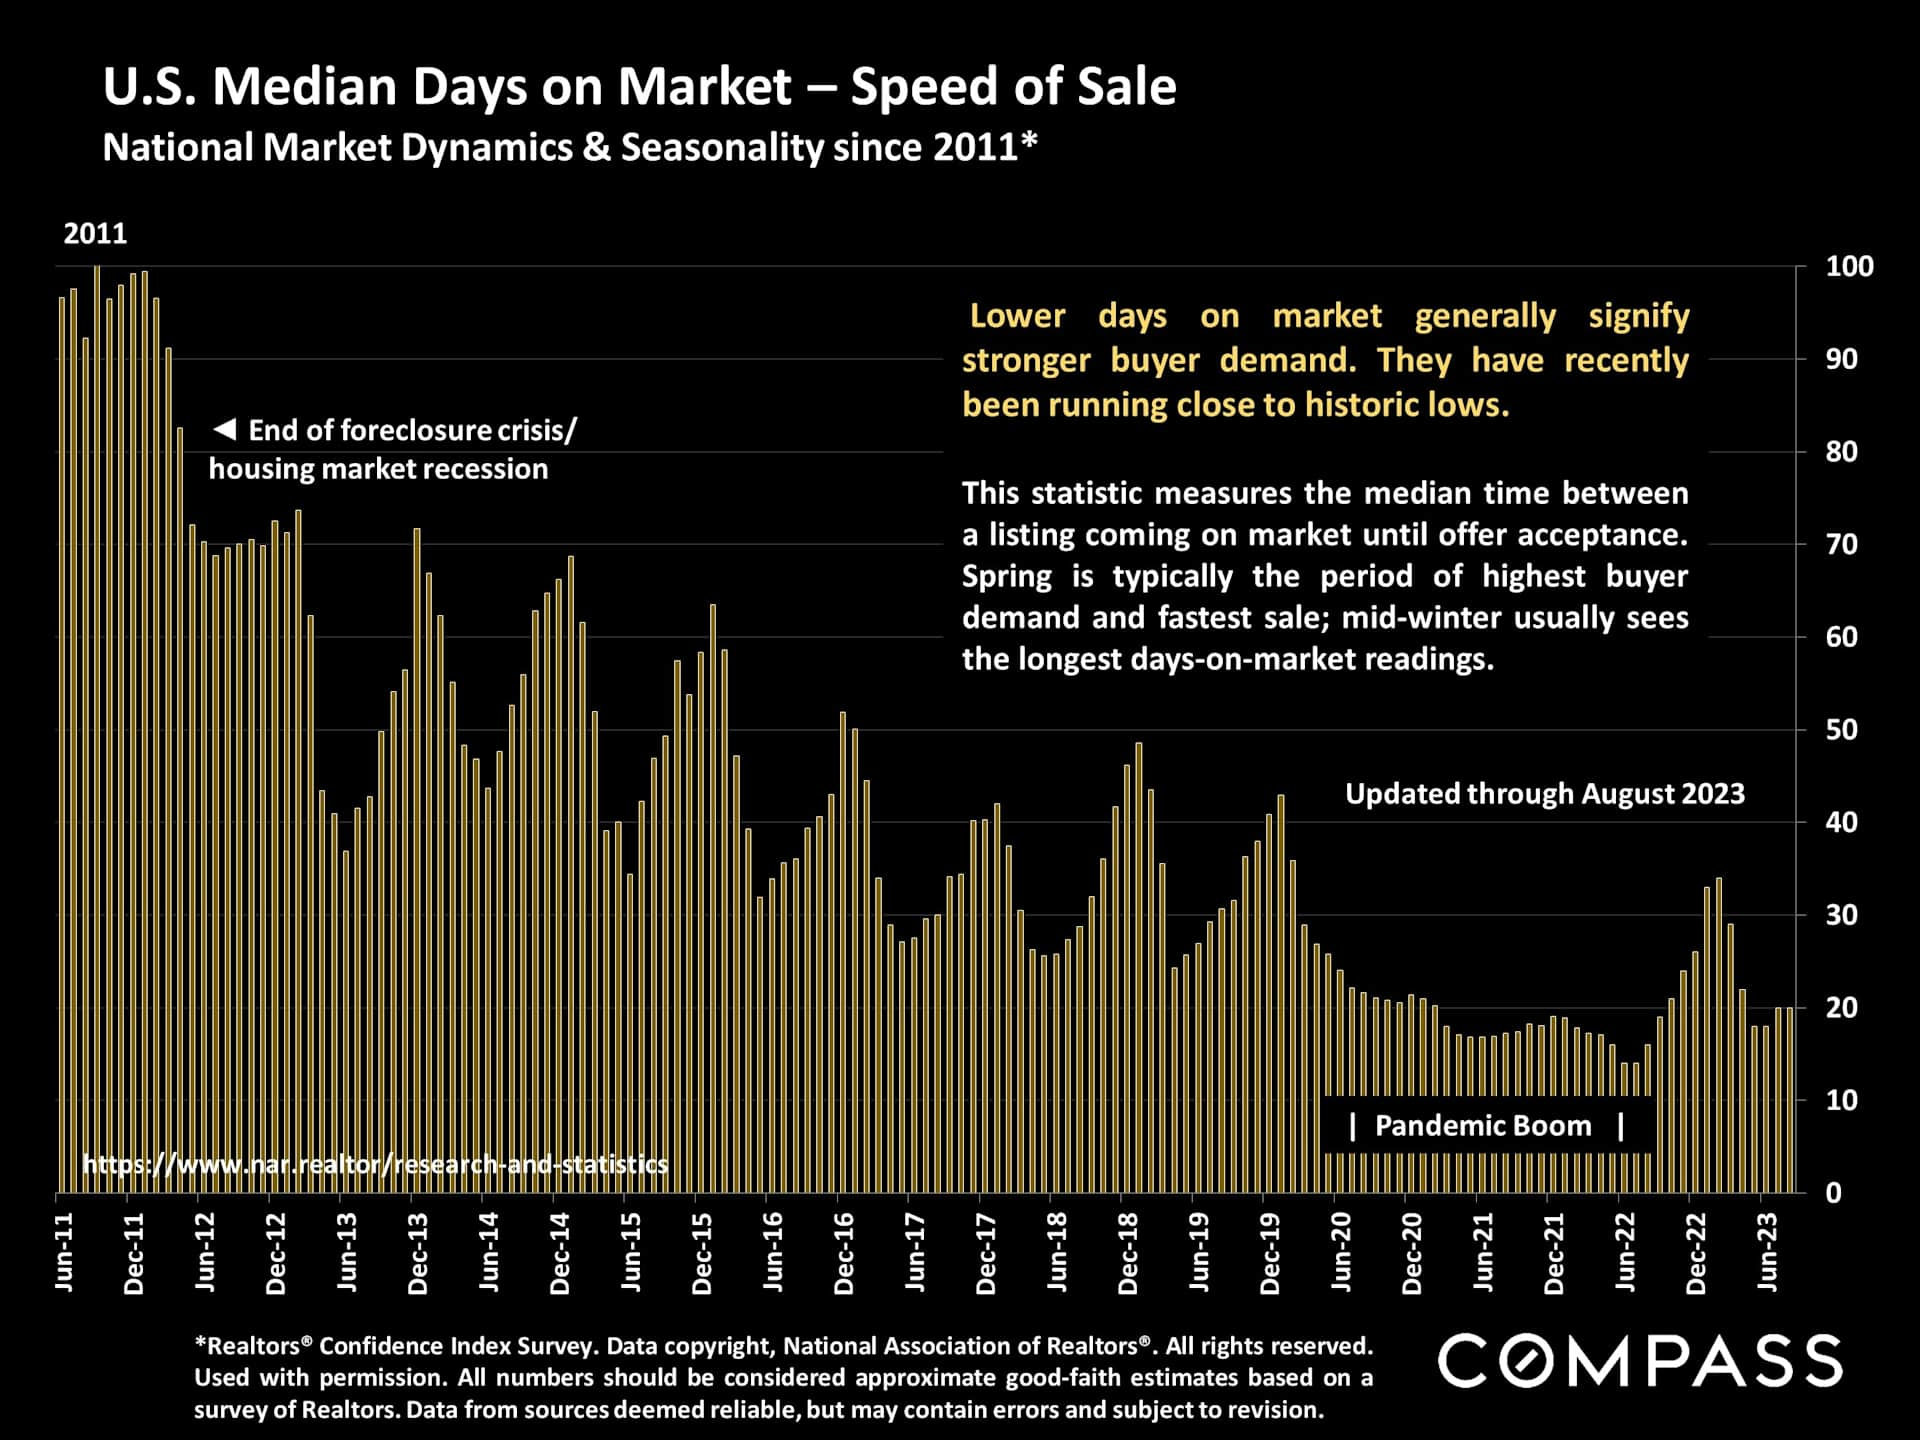
Days on market: Generally speaking, homes continue to sell very quickly, though not quite as quickly as during the height of the pandemic boom.
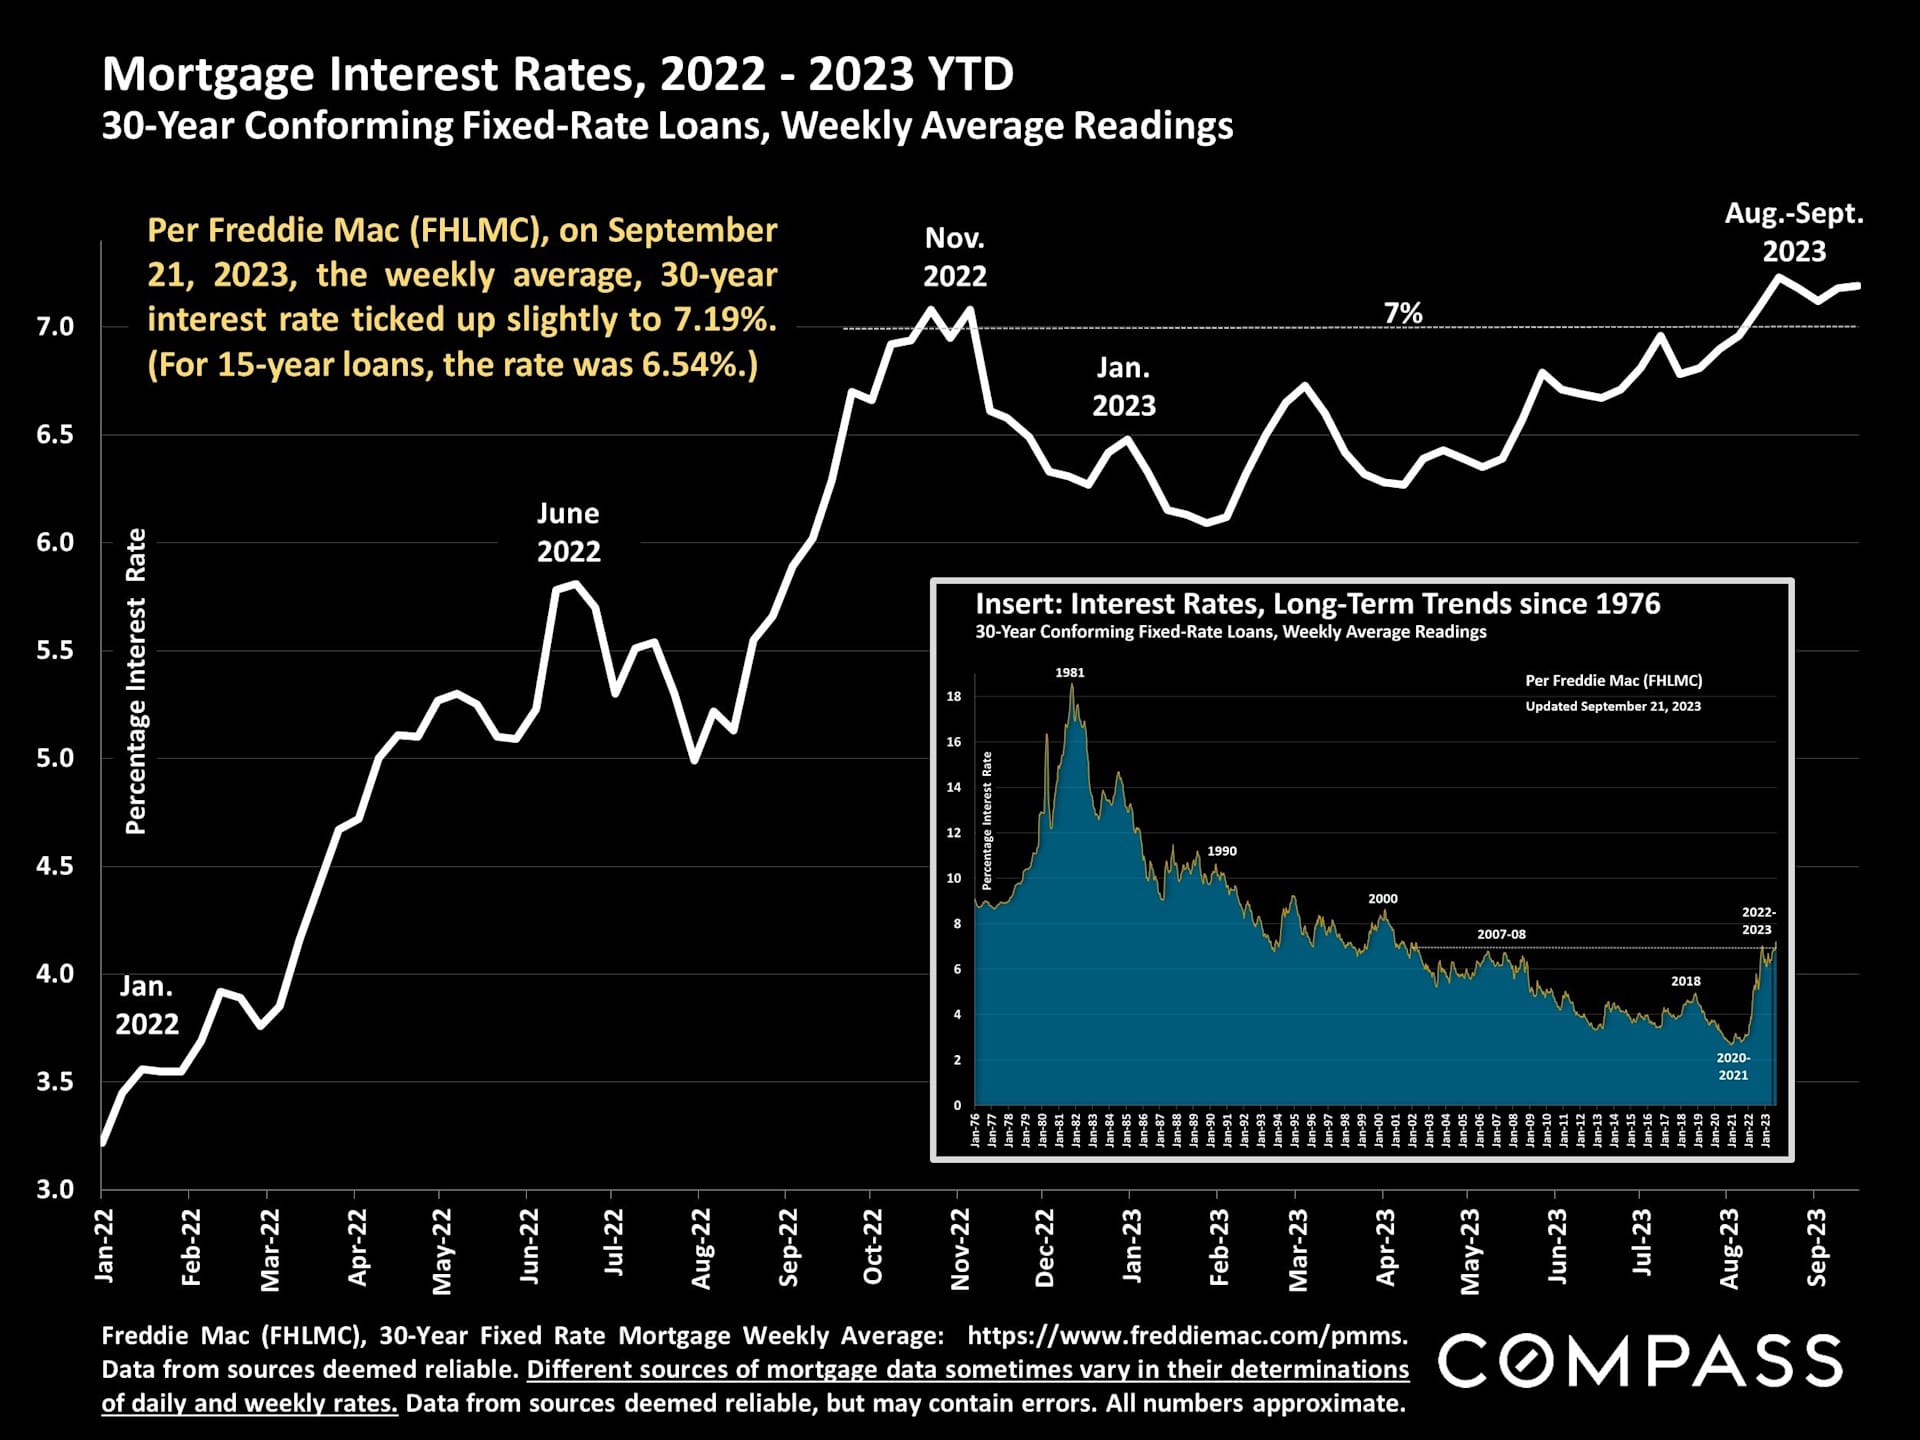
Mortgage interest rates since 2022, with an insert showing trends since 1976. Since August, rates have been bumping along above 7%.
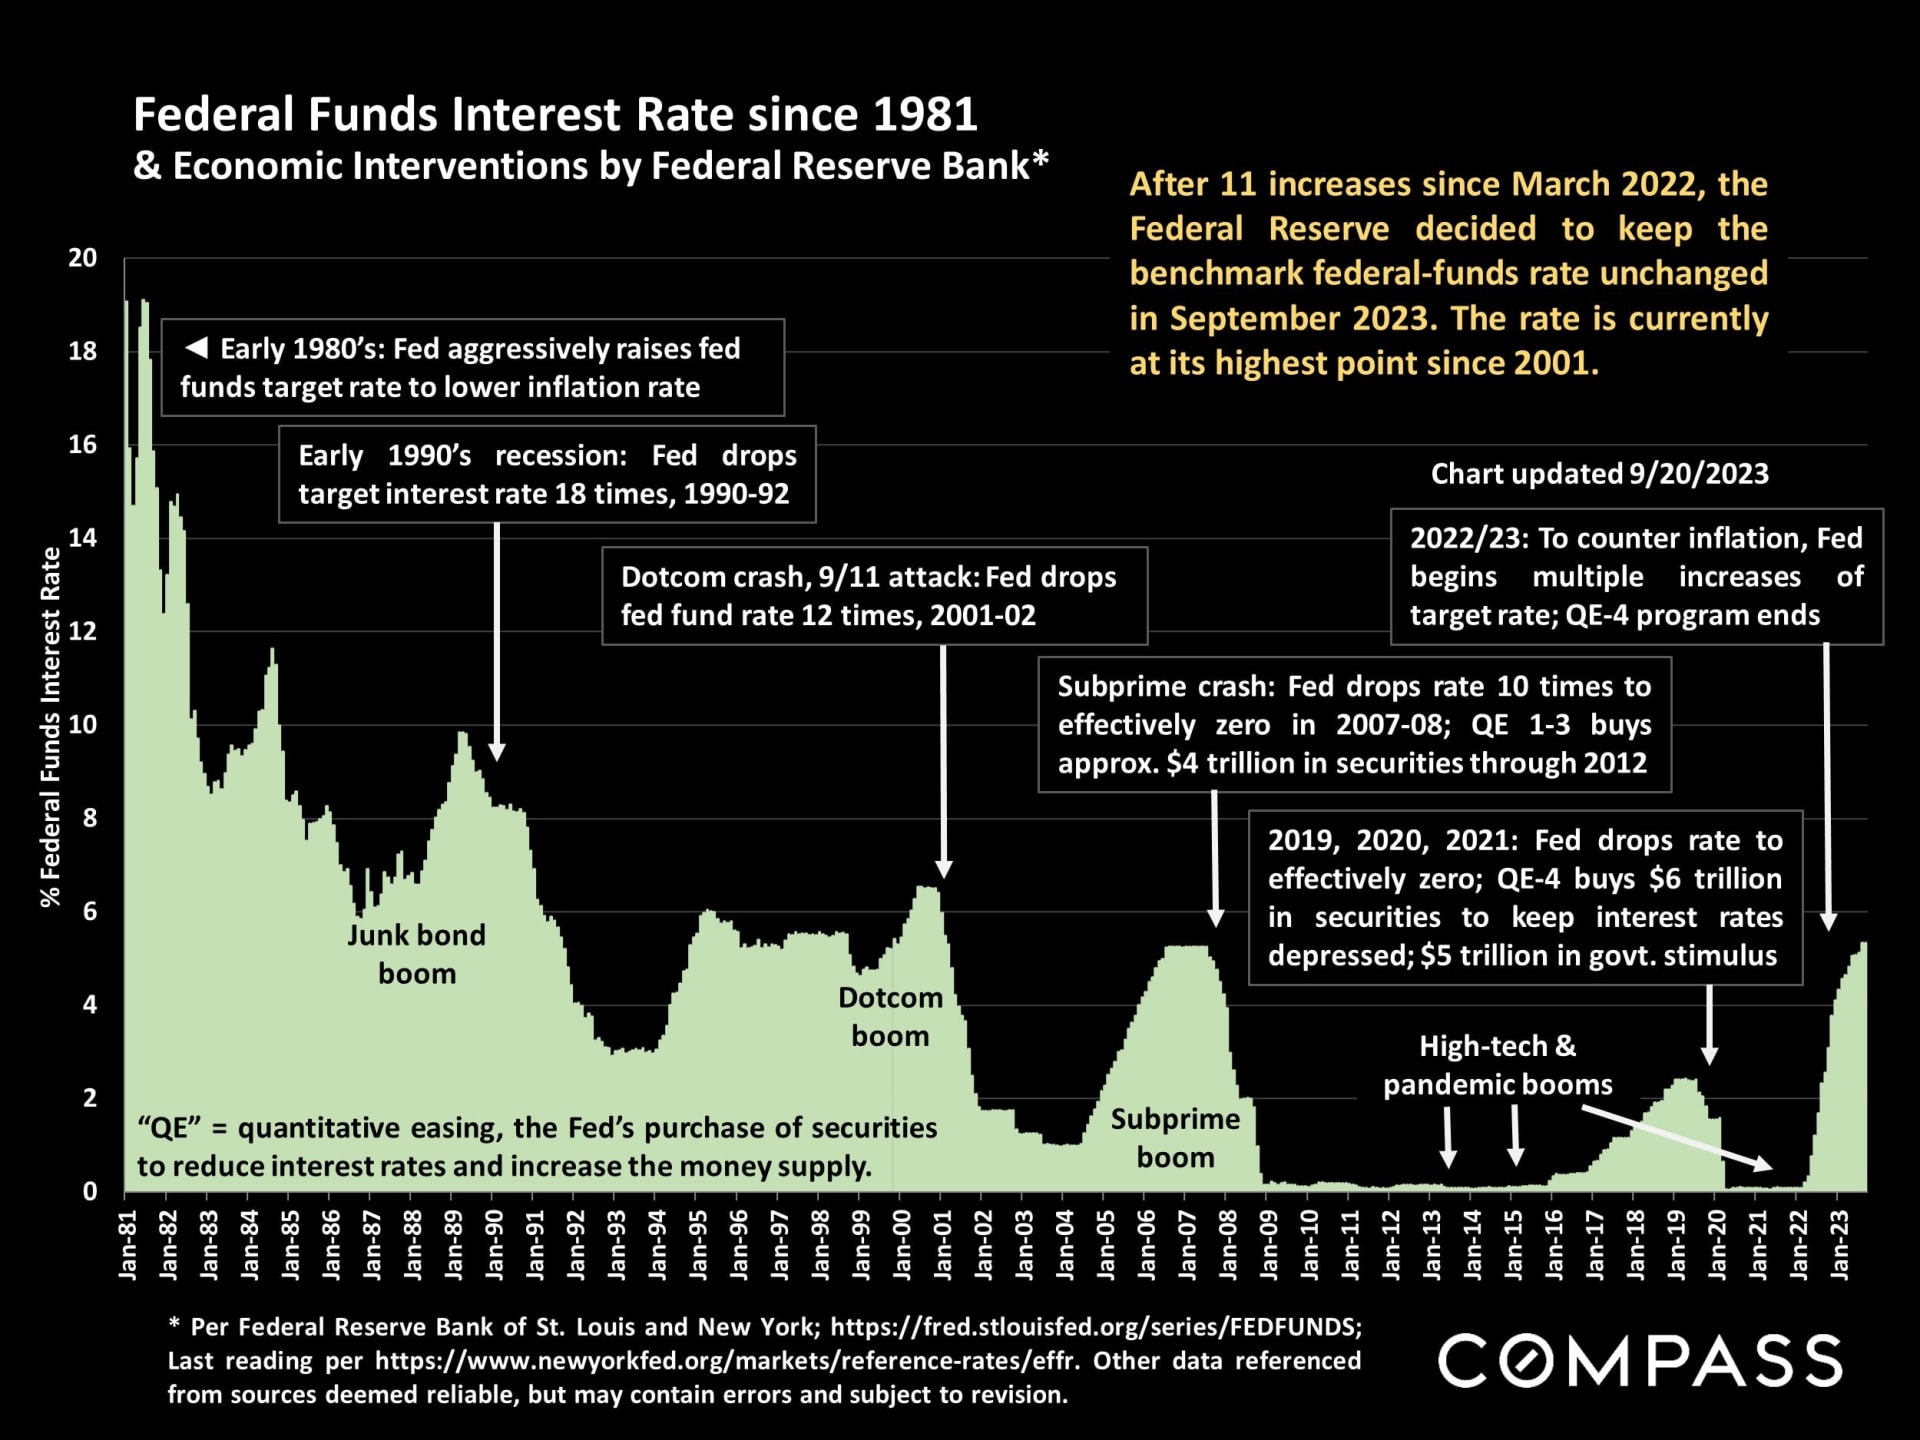
In September, the Fed paused their interest-rate increases. This chart from 1981 reviews their long history of dramatic economic interventions.
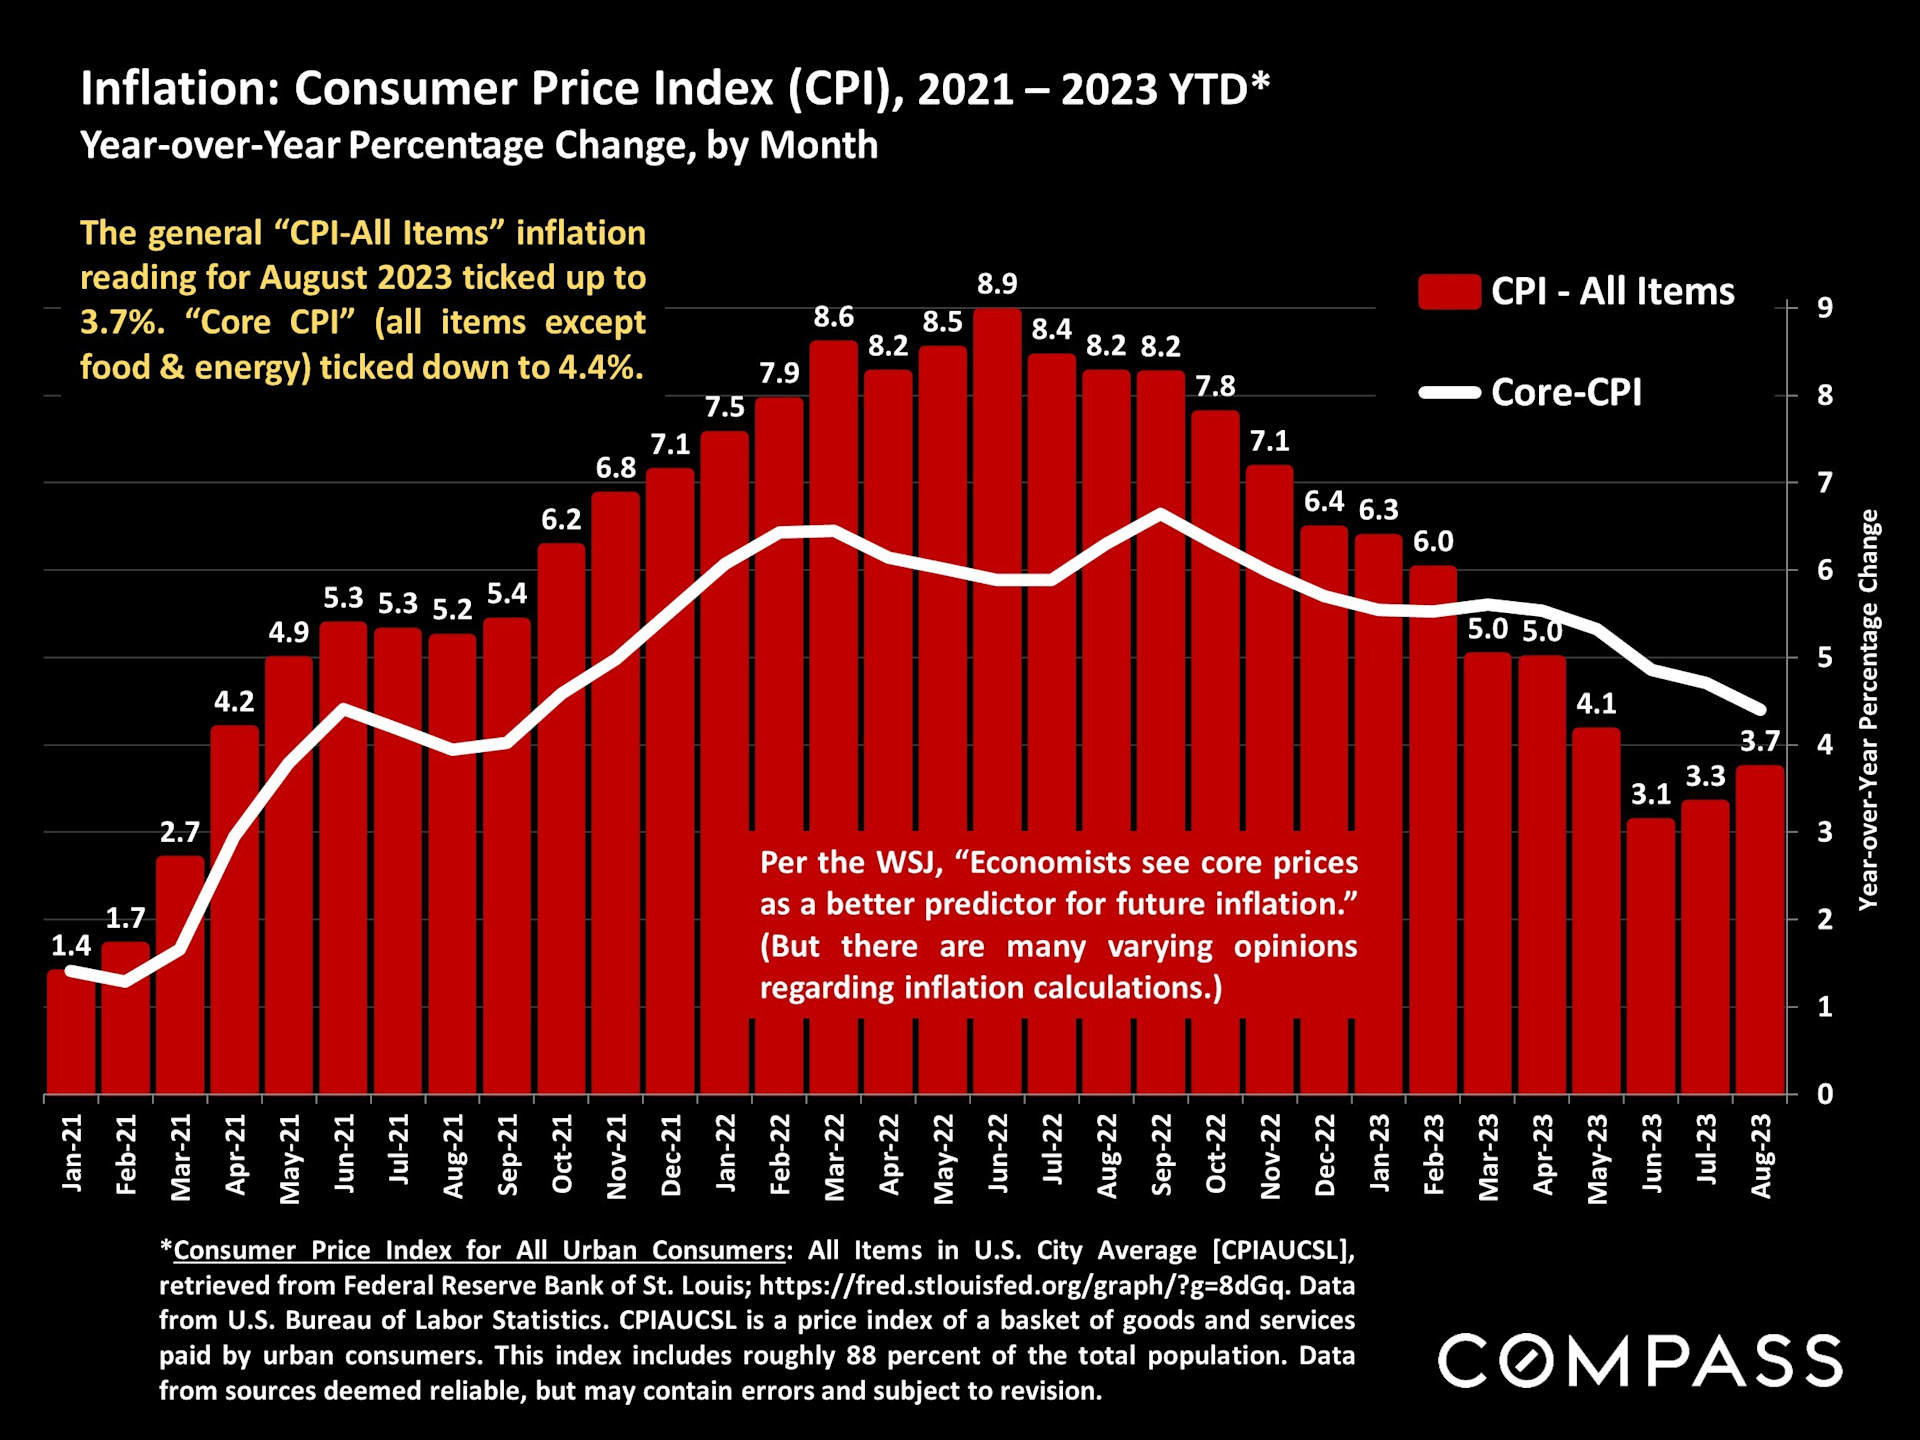
Inflation, the Fed's greatest concern, is far down from its mid-2022 peak (a 4-decade high), but has not seen significant improvement in recent months.
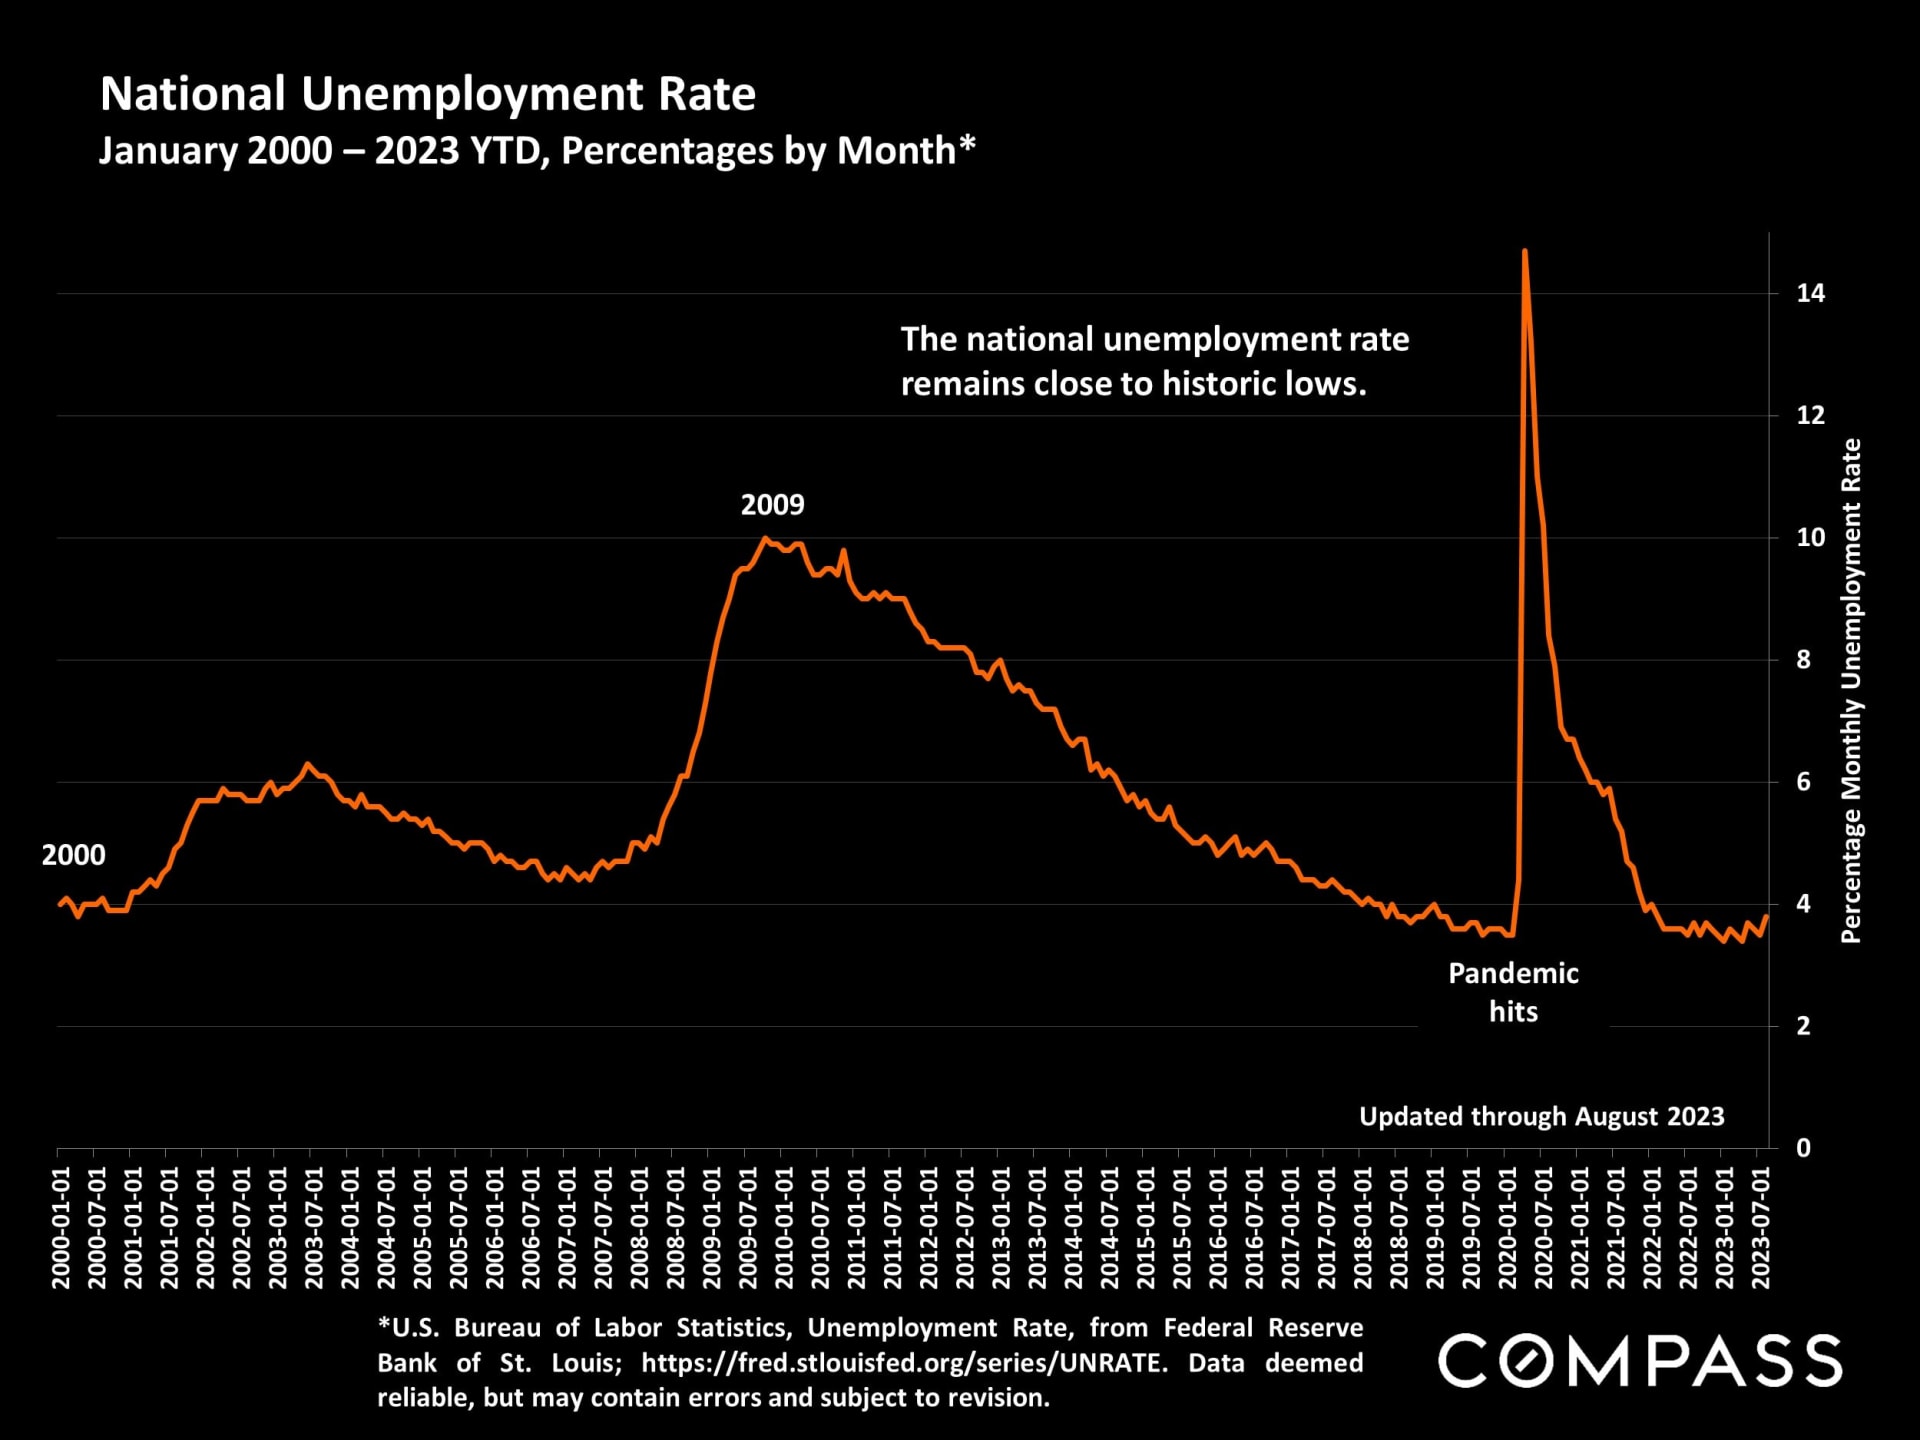
Employment has remained very strong despite the headwinds the economy has faced over the last 18 months.
Just released U.S. Census estimates for 2022: The next 2 slides review national data from a variety of angles.
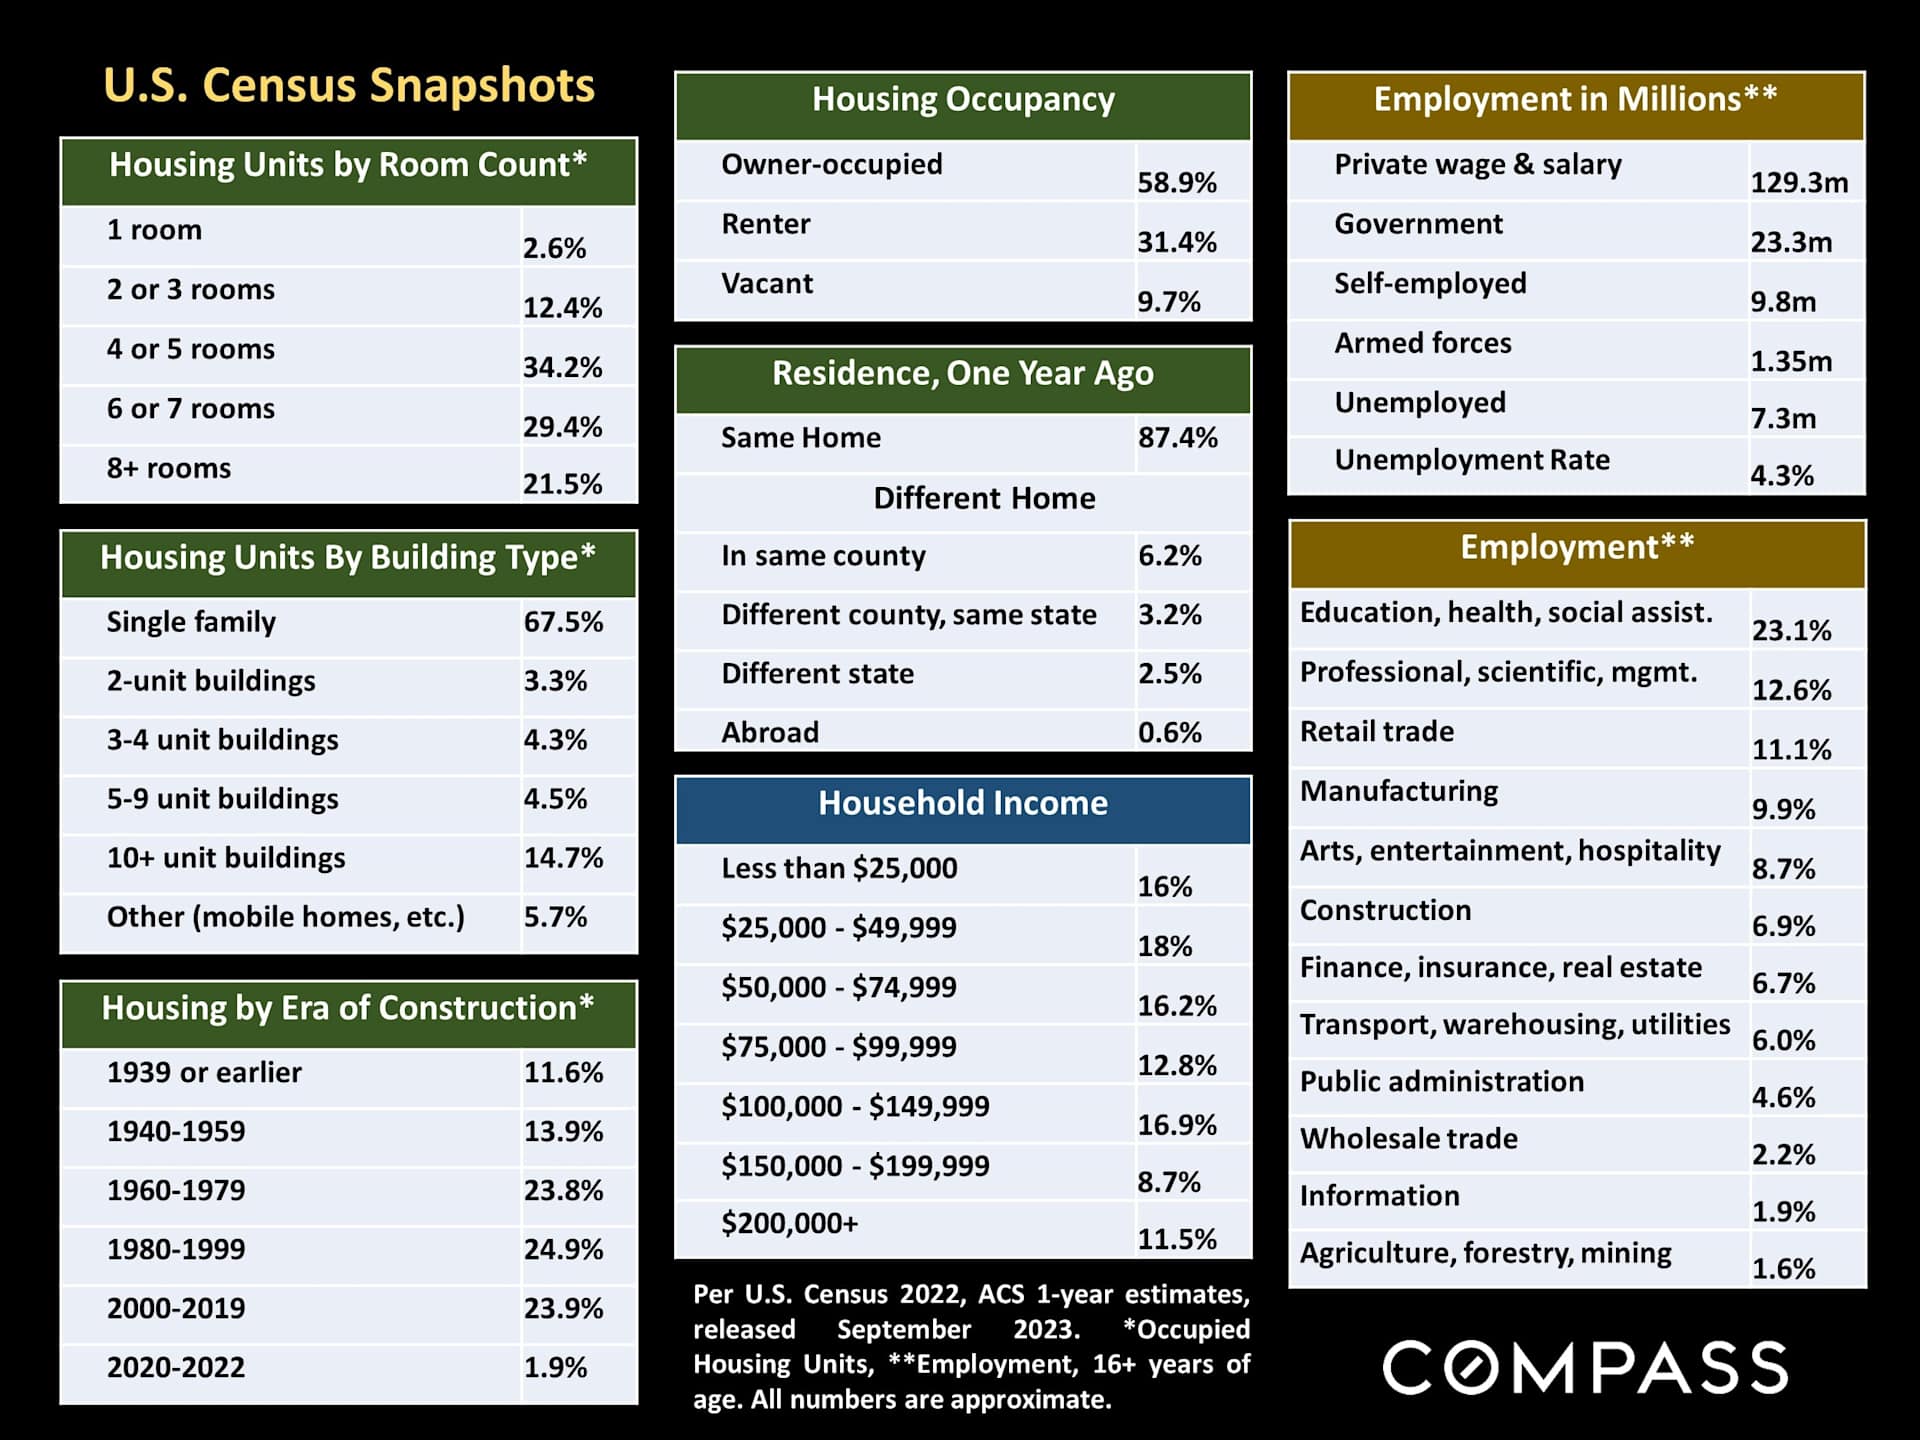
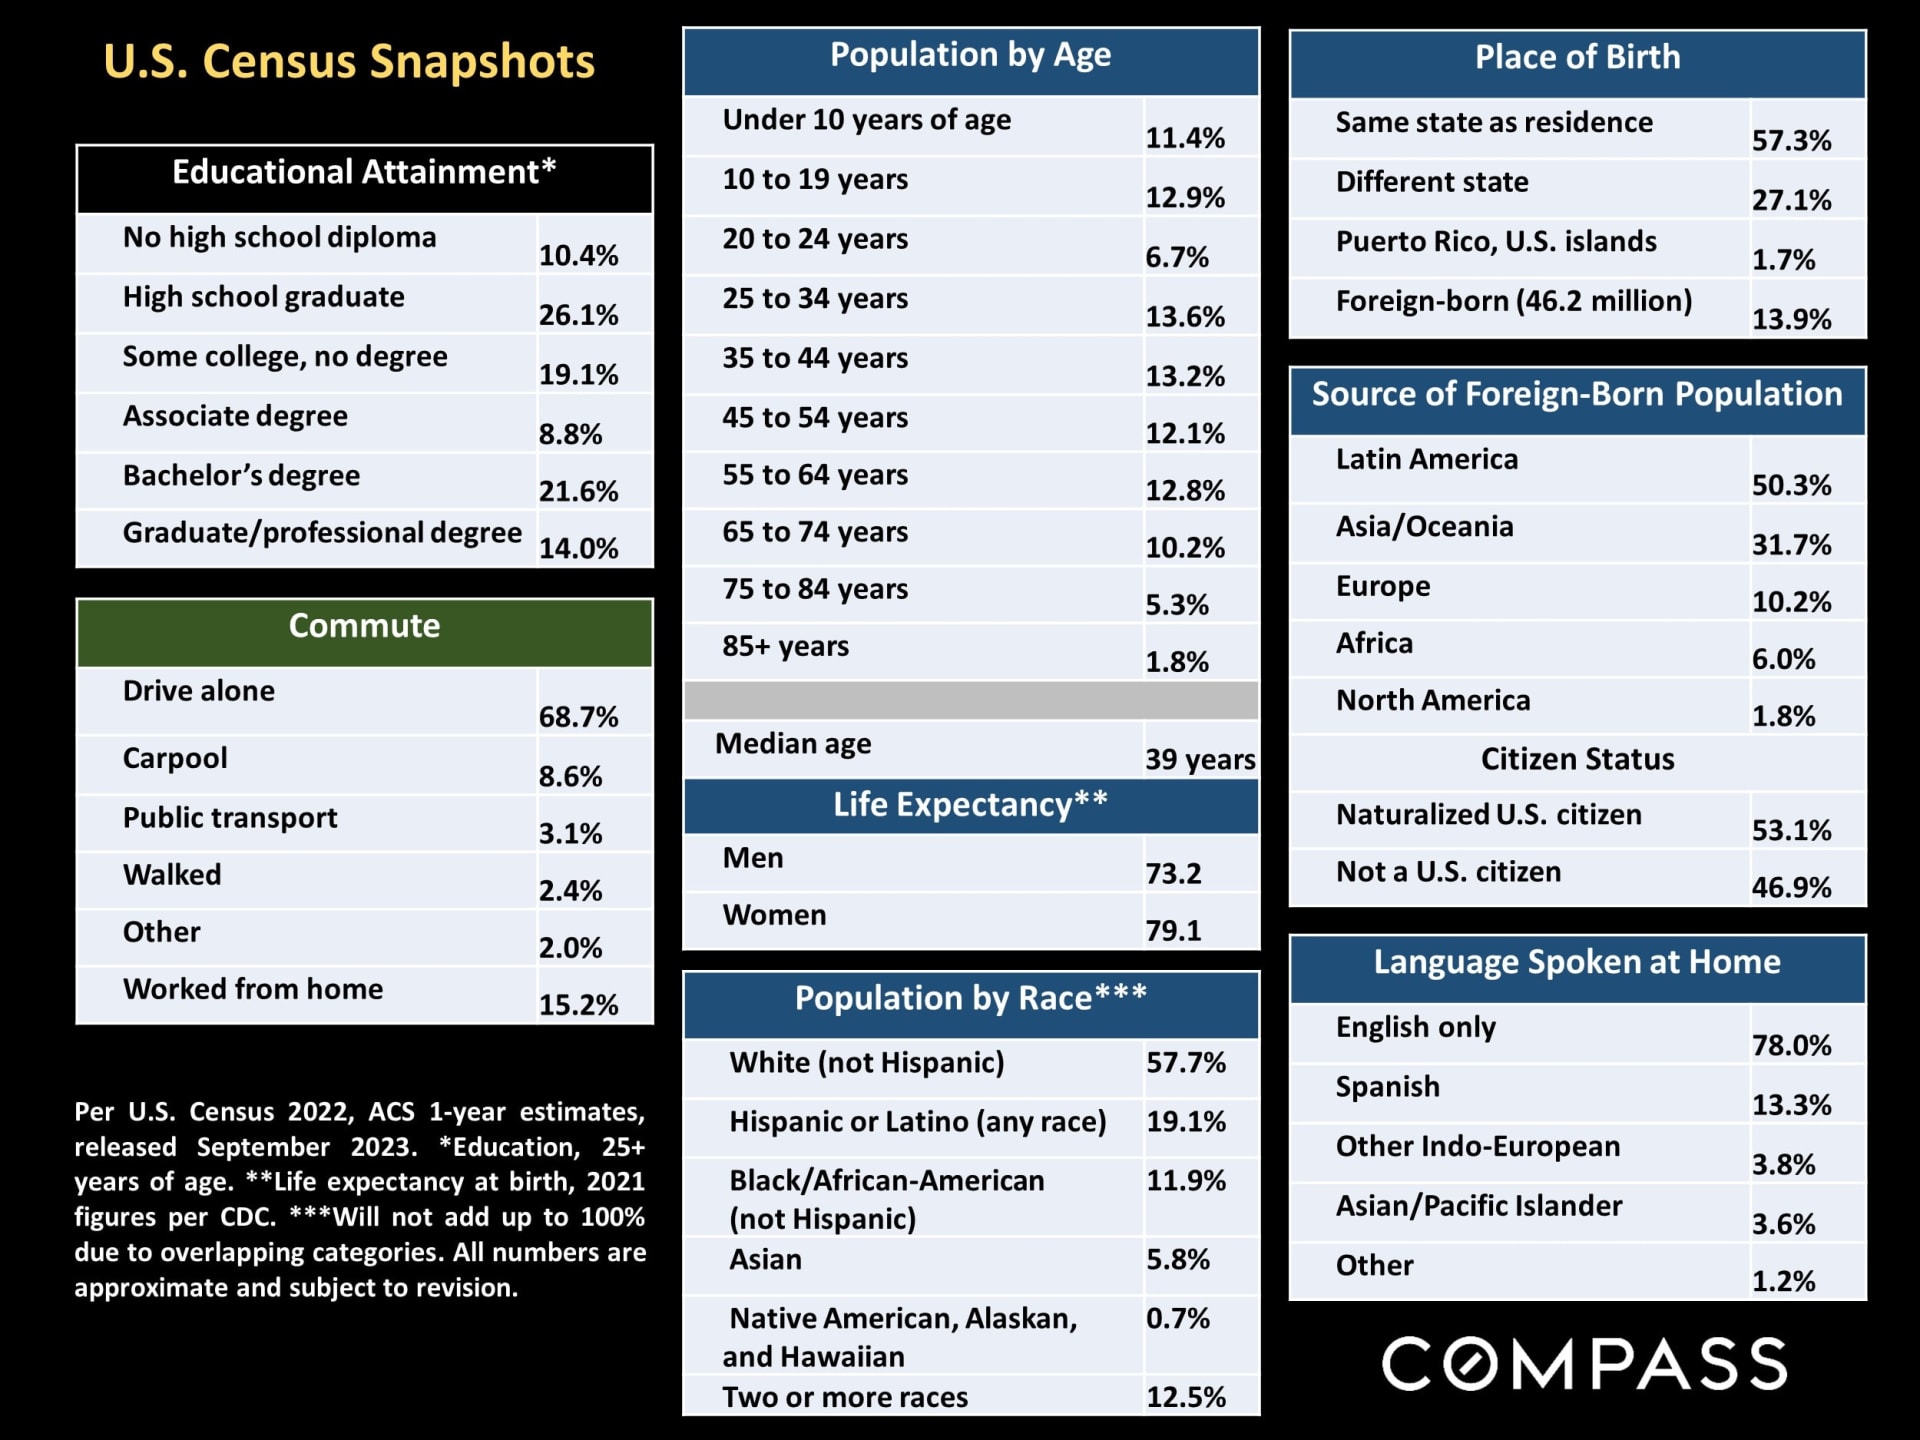
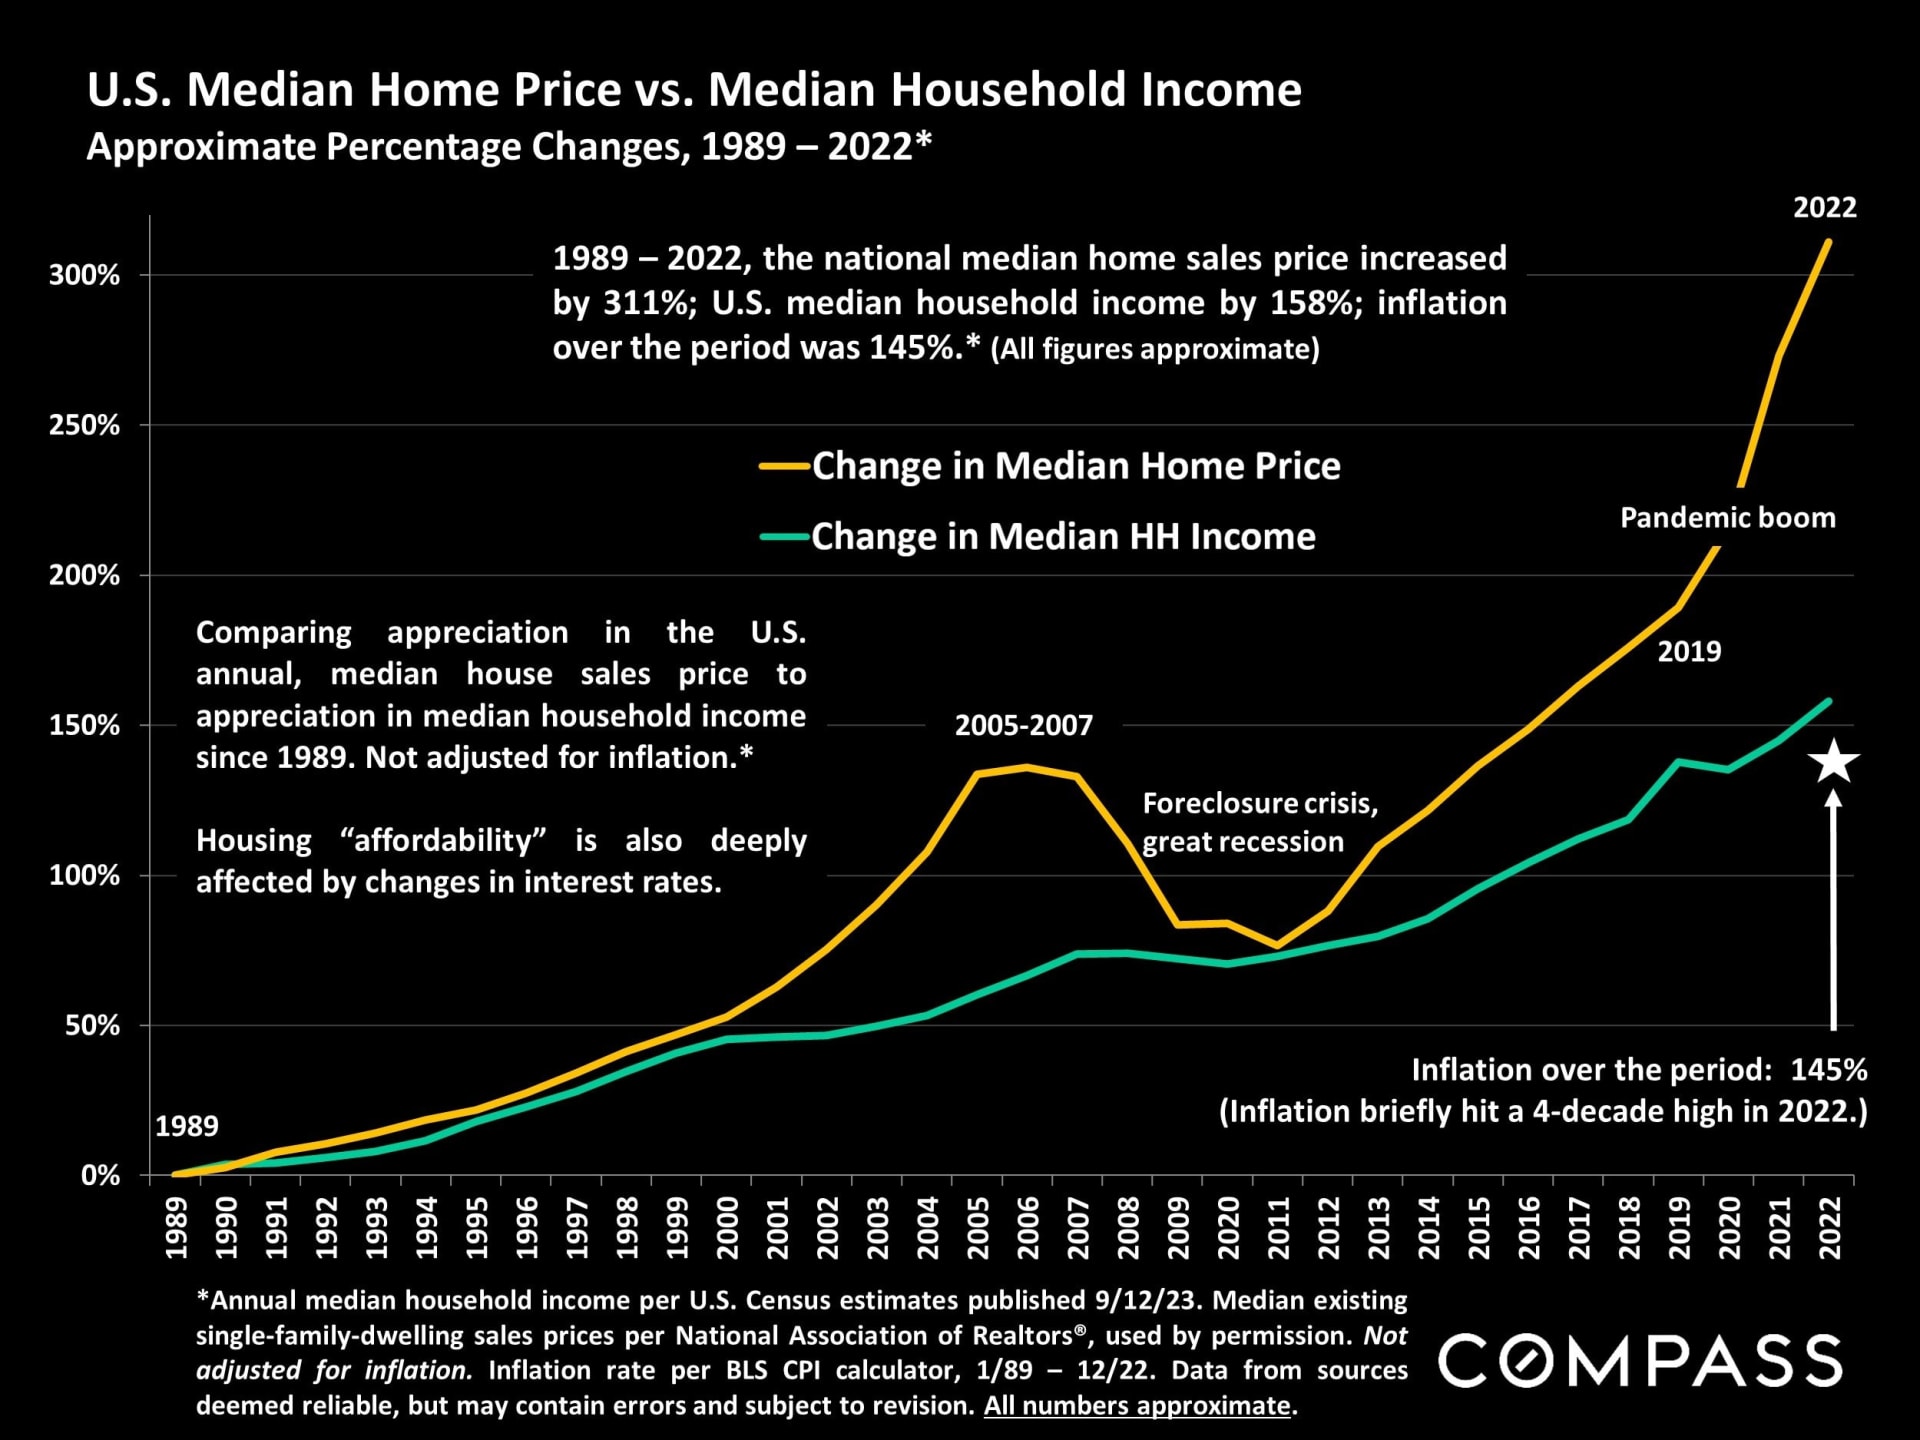
Affordability: Median home sales price appreciation vs. the change in median household income, 1989 - 2022. Interest rates are the other big factor.
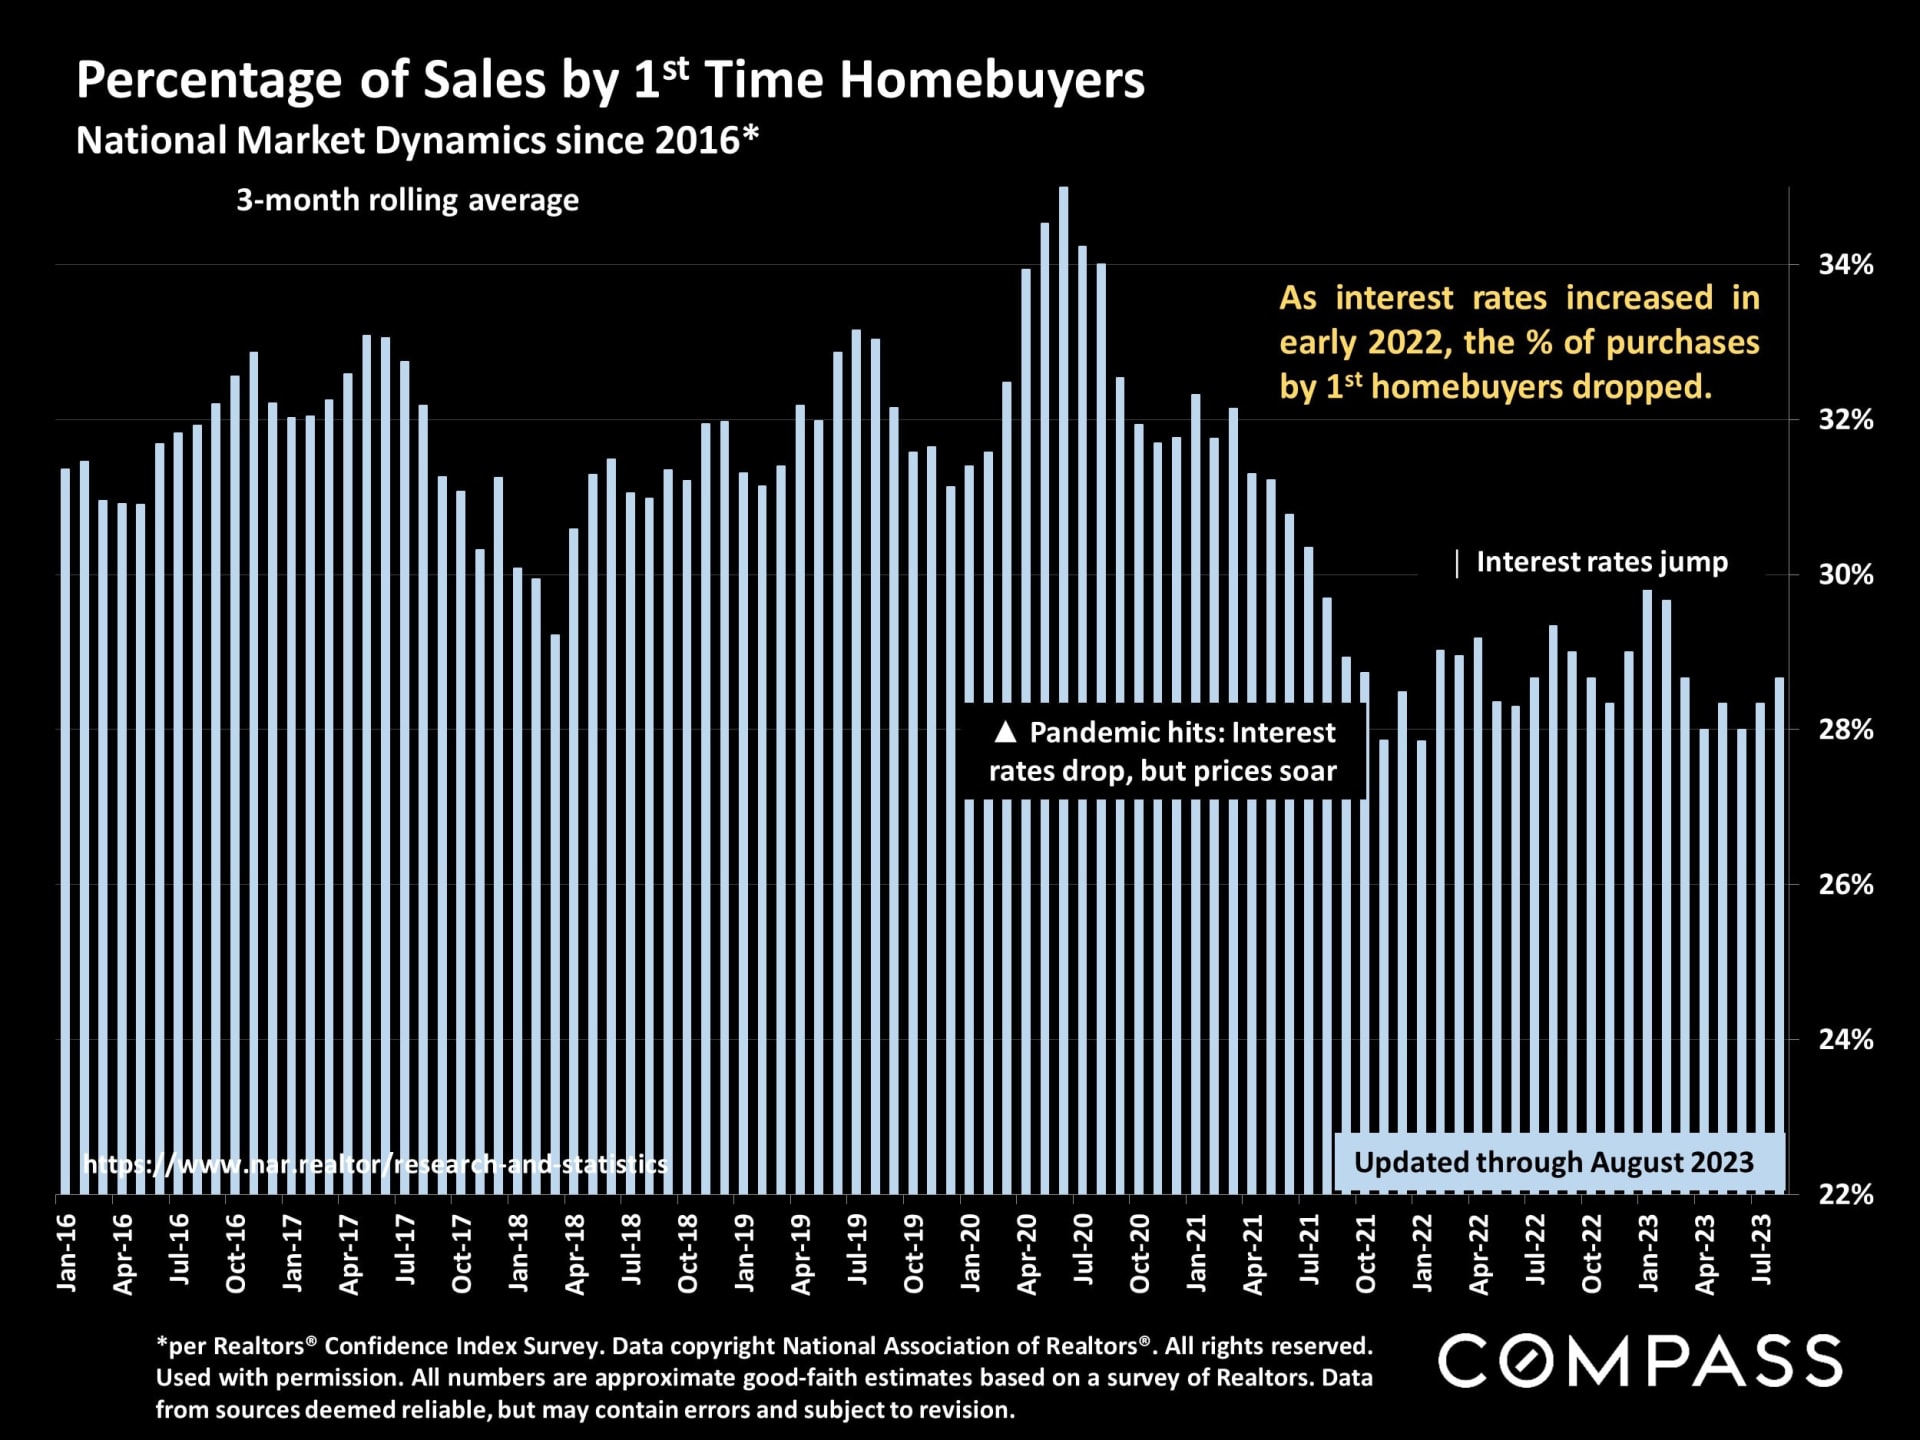
As a percentage of total sales, purchases by 1st time homebuyers have significantly declined, an important dynamic in the market.
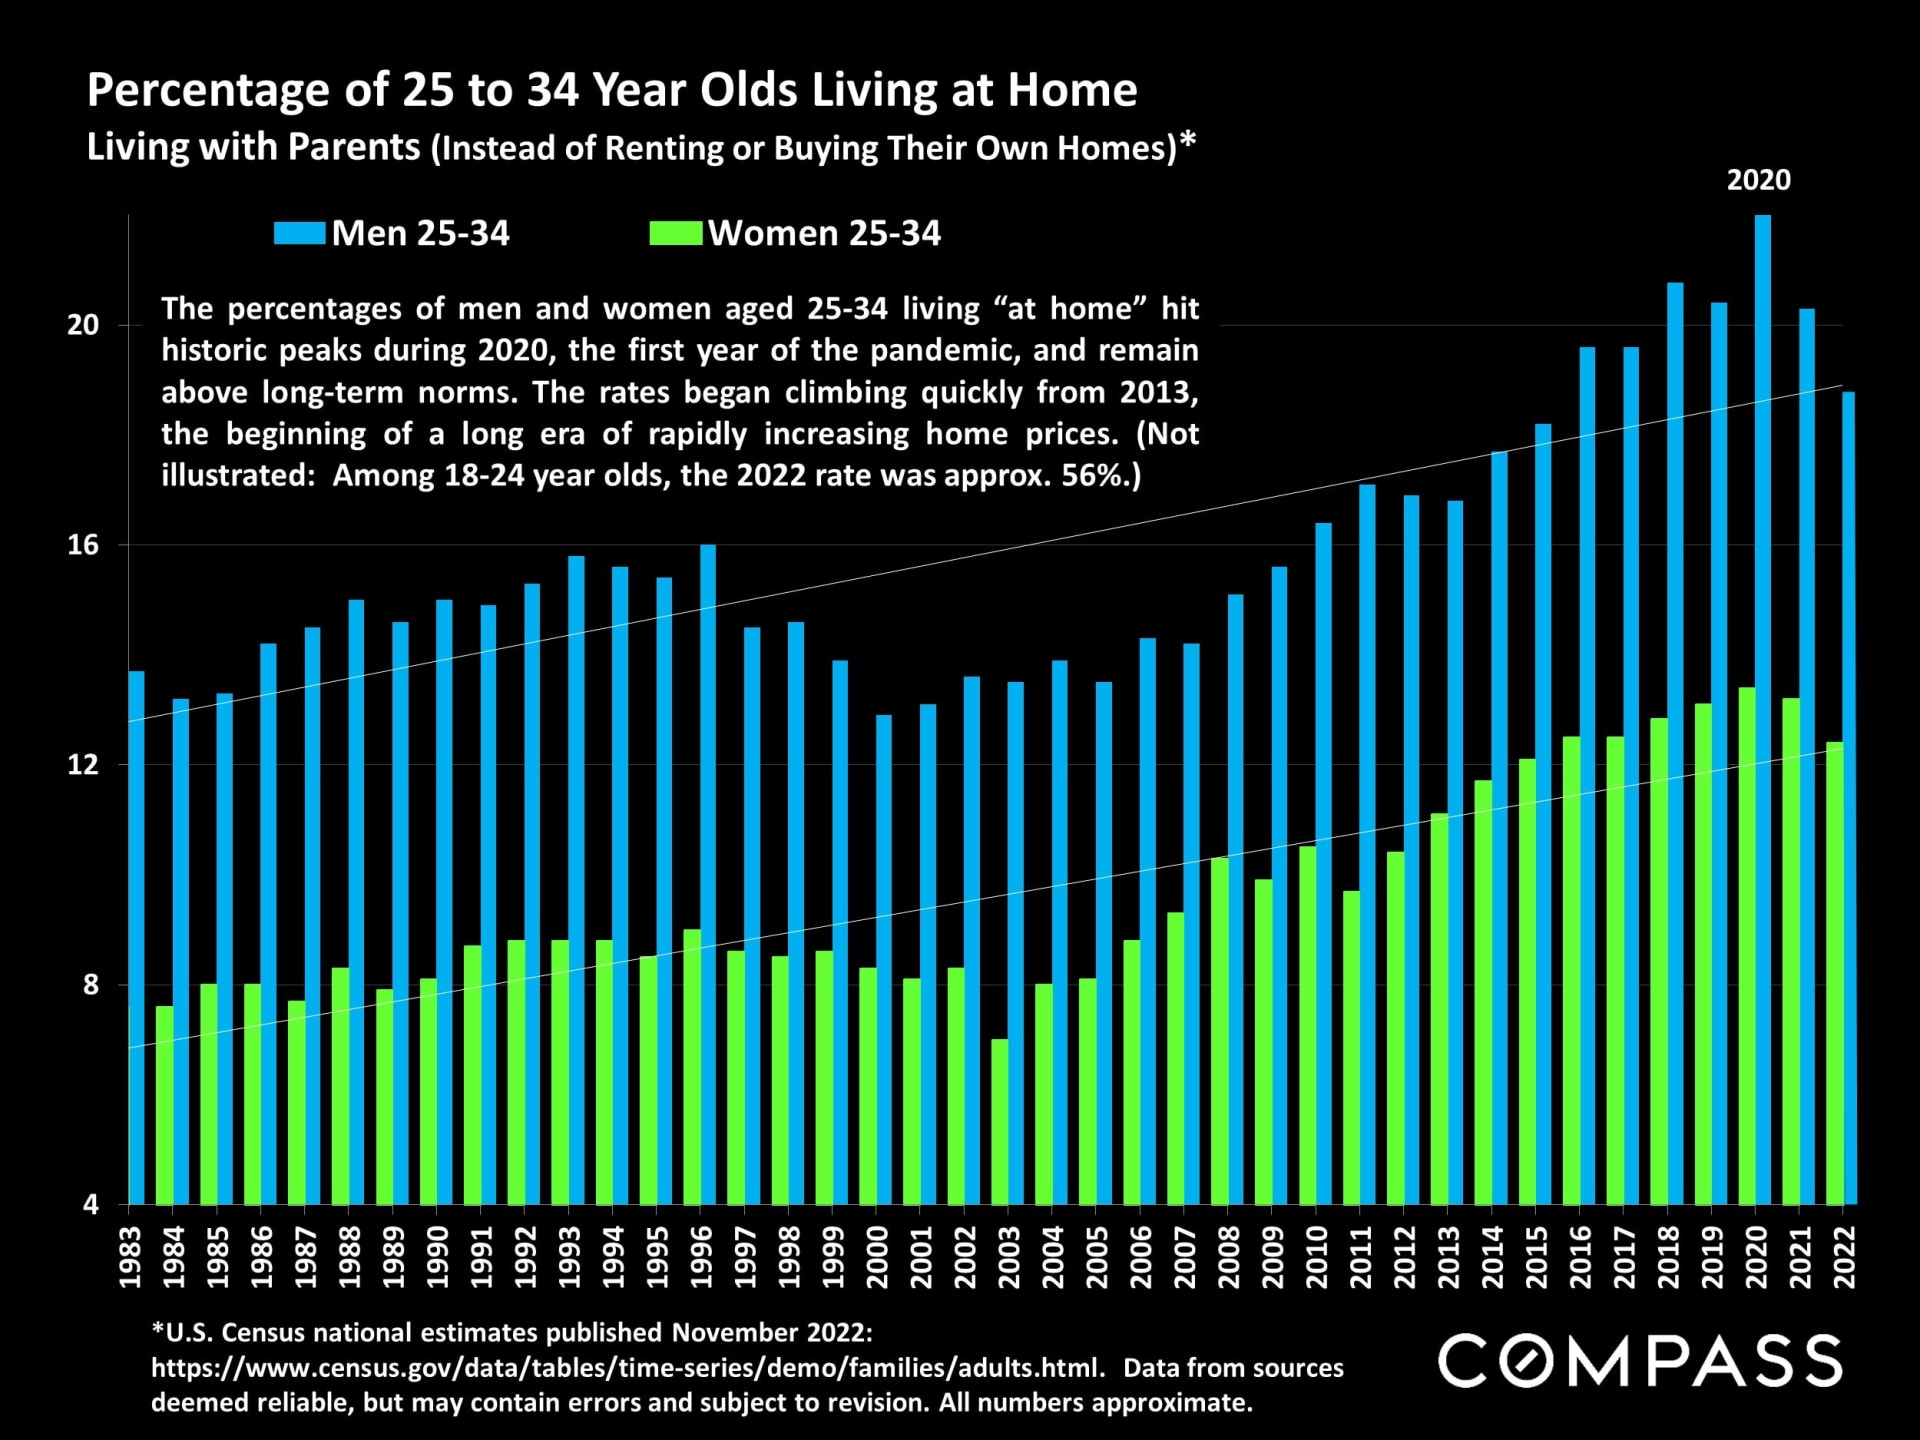
A greater percentage of younger adults - in the age segment that typically fuels new-homebuyer sales - are still living with their parents.
According to RealTrends, Compass sells more residential real estate, in dollar-volume sales, than any other brokerage in the nation.